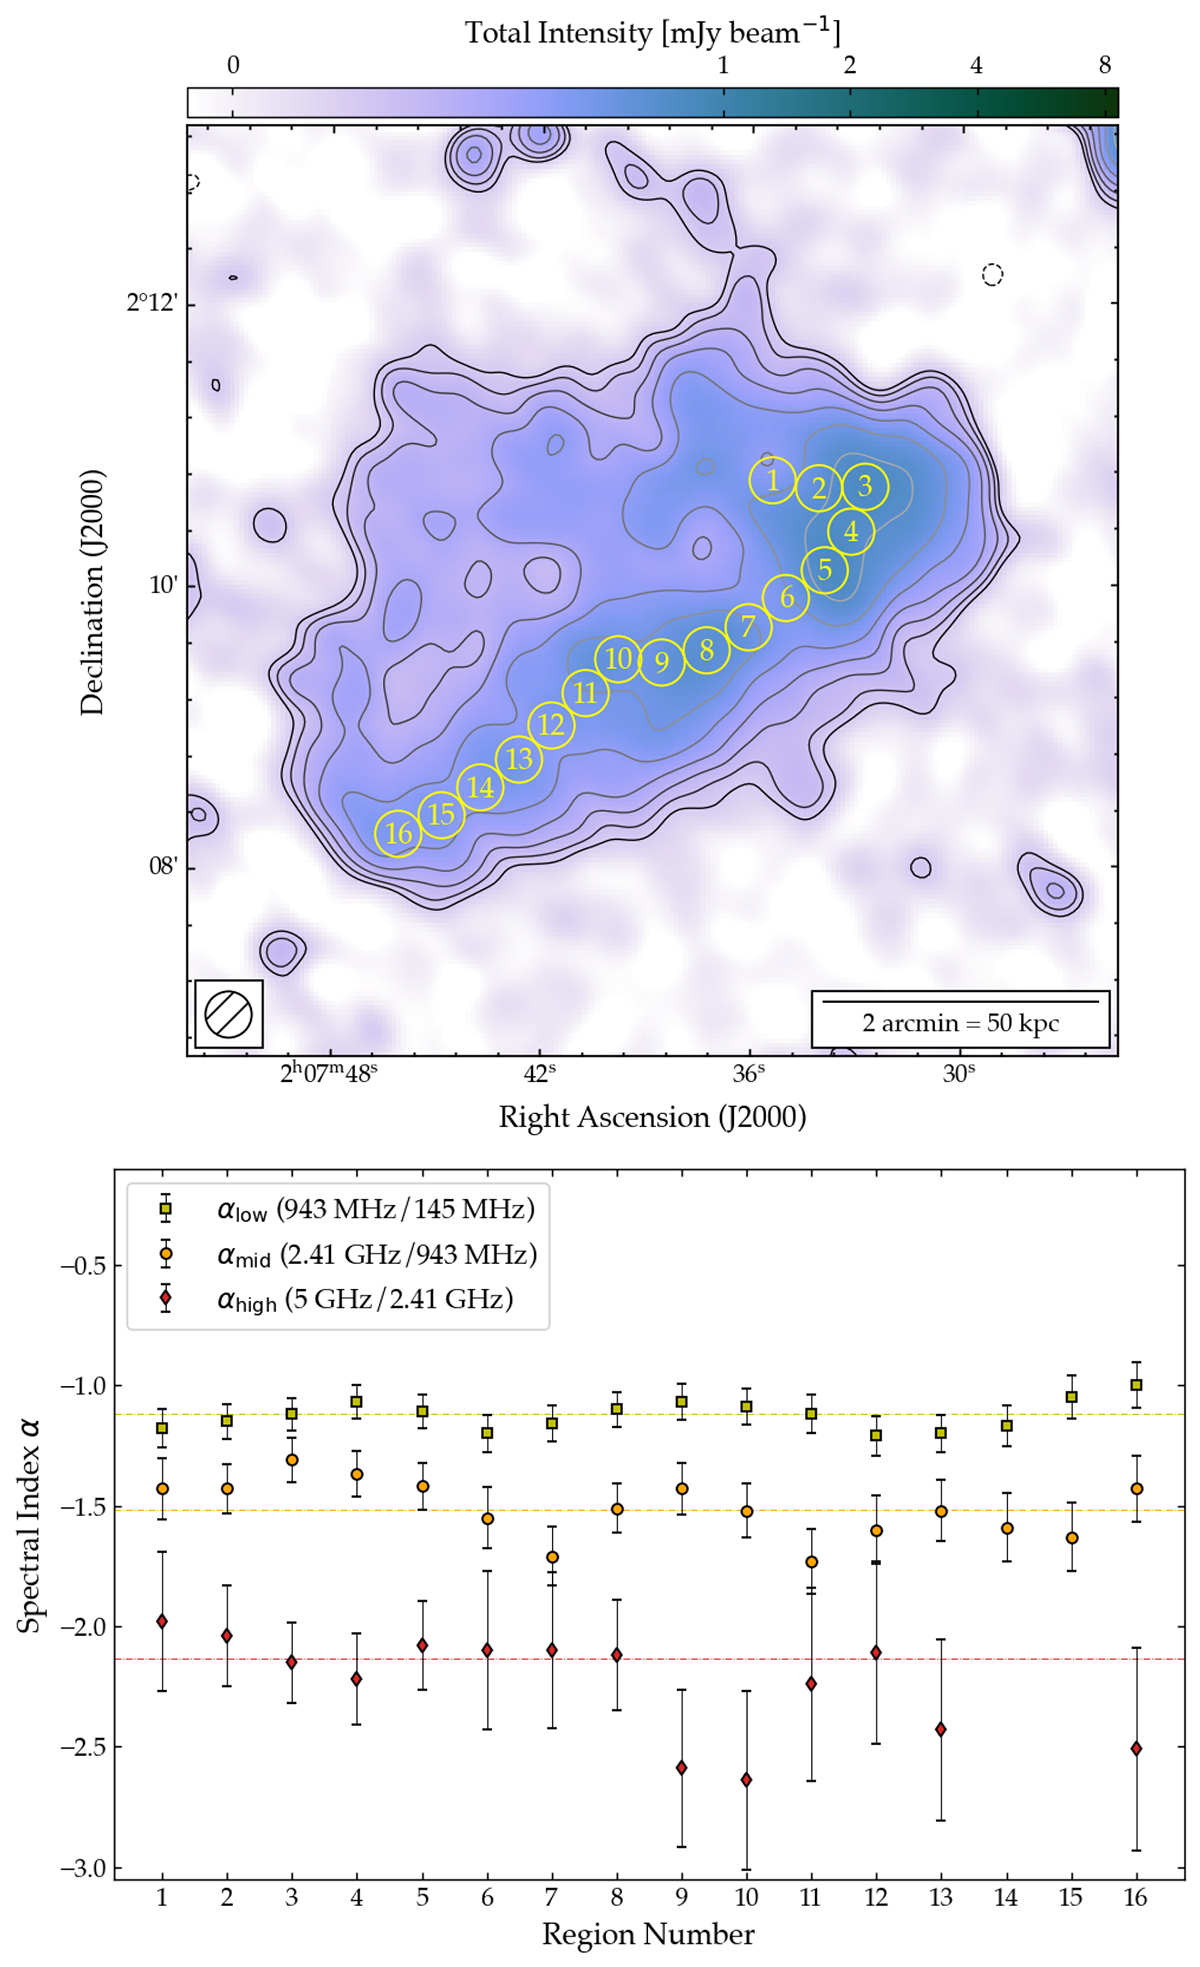
Fig. 12.
Download original image
Spectral index profile along the ‘ridge’ of diffuse emission in HCG15. The top panel shows the radio surface brightness at 943 MHz as per Fig. 8, with circular regions of 20 arcsec diameter denoting those profiled. The bottom panel shows the spectral index trend in the indicated regions. Horizontal lines show the median values for each of the αlow, αmid, and αhigh profiles.
Current usage metrics show cumulative count of Article Views (full-text article views including HTML views, PDF and ePub downloads, according to the available data) and Abstracts Views on Vision4Press platform.
Data correspond to usage on the plateform after 2015. The current usage metrics is available 48-96 hours after online publication and is updated daily on week days.
Initial download of the metrics may take a while.