Fig. 11.
Download original image
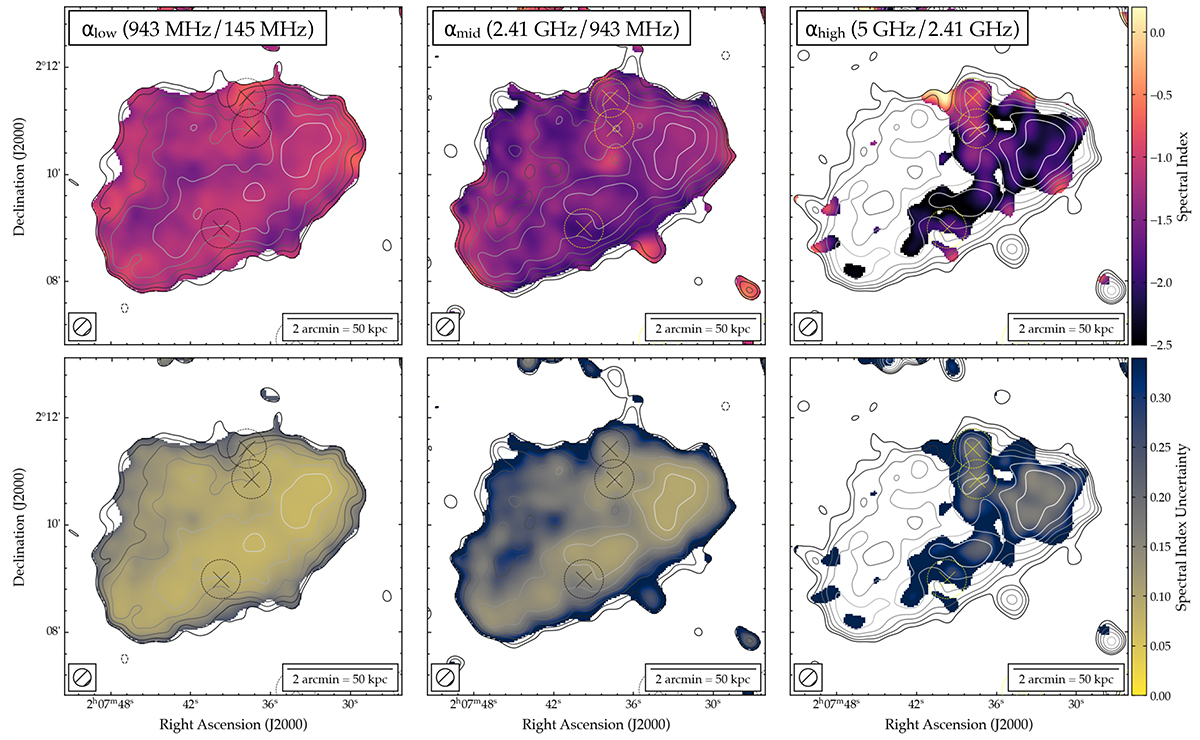
Spectral index of the diffuse radio emission associated with the IGrM of HCG15. The upper panels show the spectral index, while lower panels show the corresponding uncertainty. The spectral index is derived using maps from ASKAP/LOFAR (left), MeerKAT/ASKAP (centre), and VLA/MeerKAT (right), all at 20 arcsec resolution. The frequencies involved are shown in the inset. Contours show the source-subtracted radio emission at the lower frequency, namely, LOFAR, ASKAP, and MeerKAT from left to right. The levels are given as per Fig. 8. Markers show the positions of the group-member galaxies, whose radio counterparts have been subtracted.
Current usage metrics show cumulative count of Article Views (full-text article views including HTML views, PDF and ePub downloads, according to the available data) and Abstracts Views on Vision4Press platform.
Data correspond to usage on the plateform after 2015. The current usage metrics is available 48-96 hours after online publication and is updated daily on week days.
Initial download of the metrics may take a while.