Fig. 1.
Download original image
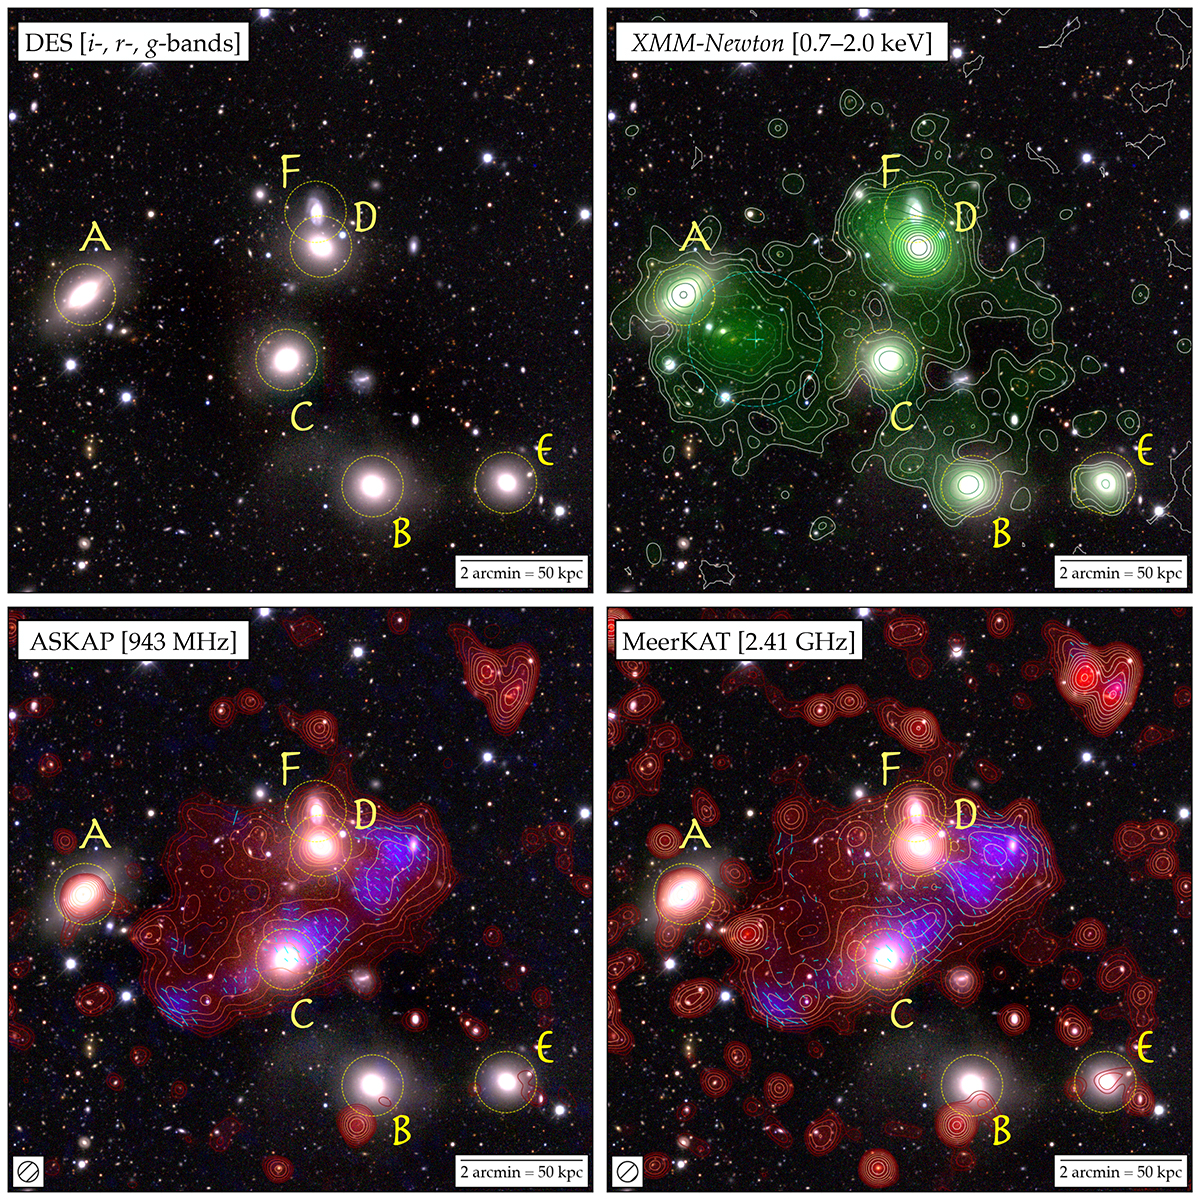
Colour-composite images of HCG15. The optical RGB image is constructed using i-, r-, and g-bands from Data Release 2 of Dark Energy Survey (DES). Green colour and contours (top-right) denote our XMM-Newton X-ray data in the 0.7 − 2.0 keV range, smoothed with a Gaussian of 7 pixels (14 arcsec) FWHM. Radio data from ASKAP at 943 MHz (lower-left) and MeerKAT at 2.4 GHz (lower-right) are shown, with red colour and contours denoting continuum emission and blue colour denoting linearly-polarised emission. All radio data are shown at a 20 arcsec resolution, as indicated by the hatched circle in the lower-left corner. Contours start at 3σ and scale by a factor of ![]() . Cyan vectors denote the orientation of the magnetic field, with vector size proportional to the fractional polarisation. Yellow circles and labels identify the six group-member galaxies; cyan ‘+’ sign in the top-right panel denotes the SZ position of a background cluster at z ≃ 0.88 reported by Klein et al. (2024), with the circle tracing a 500 kpc radius.
. Cyan vectors denote the orientation of the magnetic field, with vector size proportional to the fractional polarisation. Yellow circles and labels identify the six group-member galaxies; cyan ‘+’ sign in the top-right panel denotes the SZ position of a background cluster at z ≃ 0.88 reported by Klein et al. (2024), with the circle tracing a 500 kpc radius.
Current usage metrics show cumulative count of Article Views (full-text article views including HTML views, PDF and ePub downloads, according to the available data) and Abstracts Views on Vision4Press platform.
Data correspond to usage on the plateform after 2015. The current usage metrics is available 48-96 hours after online publication and is updated daily on week days.
Initial download of the metrics may take a while.