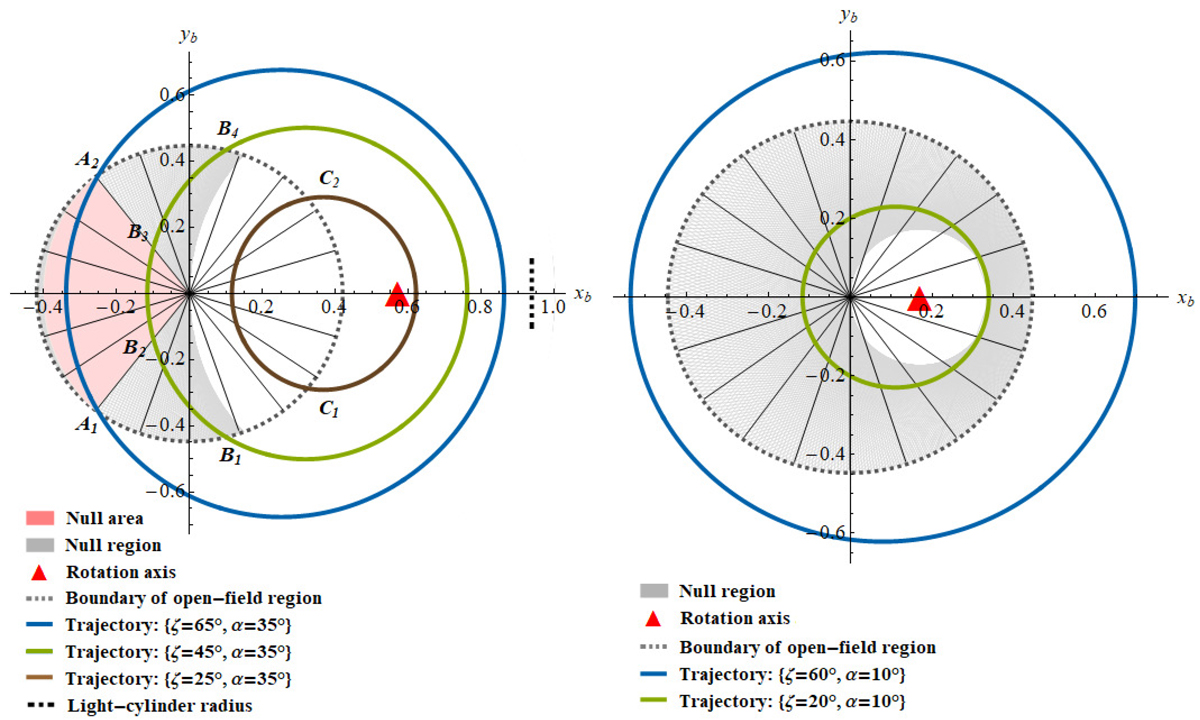
Fig. 2.
Download original image
Illustrations for two open-field (emission) regions at height 0.2 rL, bounded by dotted gray curve, are shown in the magnetic frame for α = 35° (left) and 10° (right). The size of the magnetosphere is assumed to be one unit. The rotation axis is stationary relative to the magnetic axis, with the location marked by the red triangle. Each emission region is divided into 20 equal emission segments around the magnetic pole that is located at the origin. Also illustrated, we have the null region in gray and the null area in pink (left-hand plot only). In the left-hand plot, three trajectories of the visible point are plotted using ζ = 65° (blue), 45° (green), and 25° (brown), while the location of the light-cylinder radius on the x-axis is indicated by a black vertical dotted line. In the right-hand plot, the two trajectories are obtained using ζ = 60° (blue), which does not cut the open-field region, and 20° (green). More details are given in the main text.
Current usage metrics show cumulative count of Article Views (full-text article views including HTML views, PDF and ePub downloads, according to the available data) and Abstracts Views on Vision4Press platform.
Data correspond to usage on the plateform after 2015. The current usage metrics is available 48-96 hours after online publication and is updated daily on week days.
Initial download of the metrics may take a while.