Fig. 6.
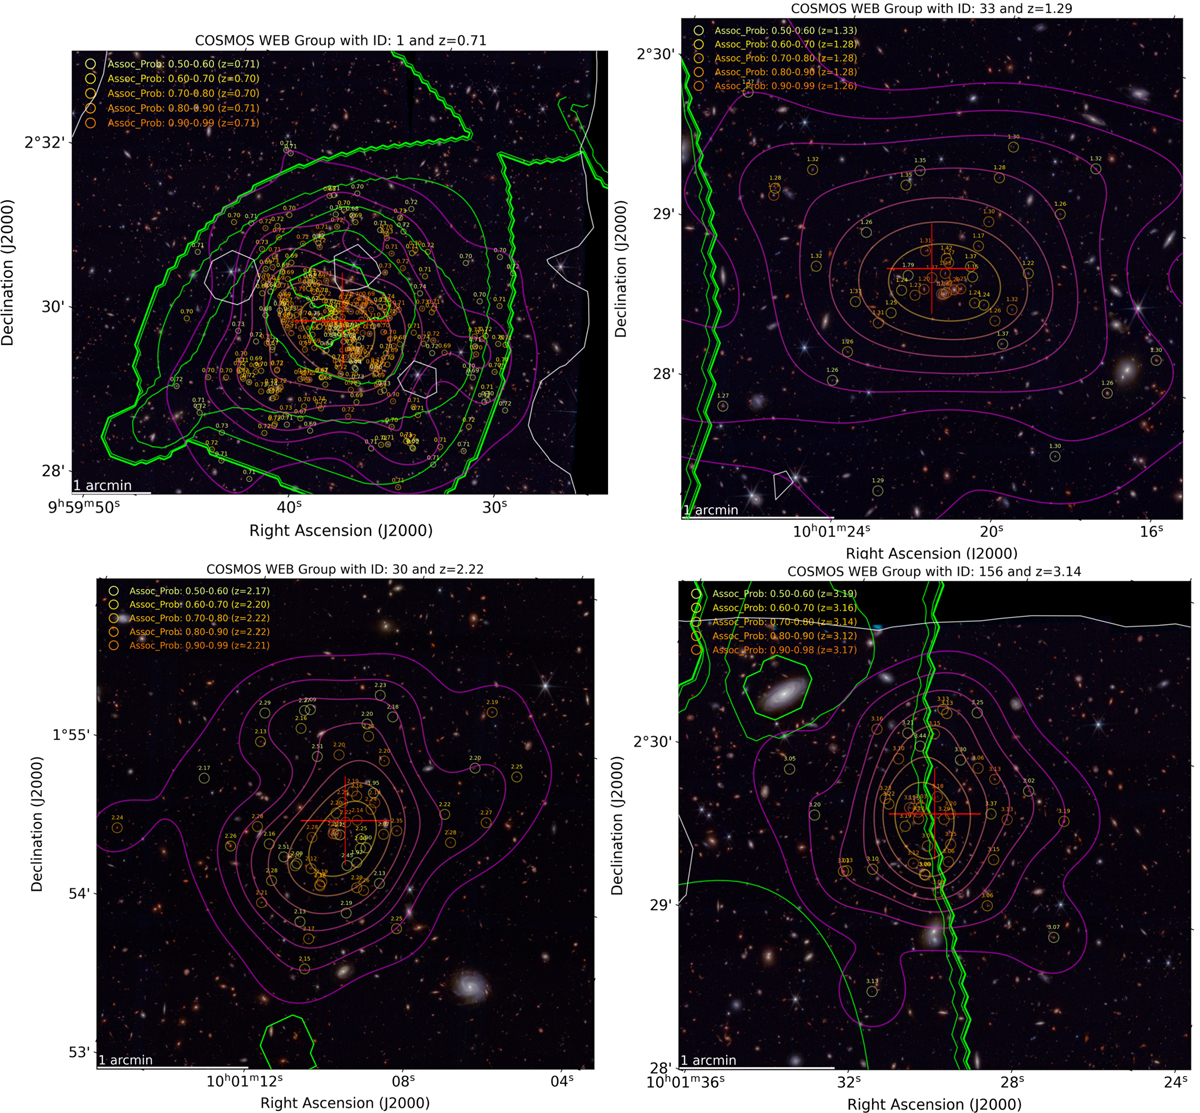
Download original image
Four examples of detections present in the group catalog, at different redshifts. Circles indicate member galaxies, color-coded with membership probability and with their redshift printed next to each circle. Purple-to-yellow contours mark the density of galaxies and green contours the X-ray emission from the combined XMM-Newton and Chandra mosaic image in the 0.5−2 keV band. White lines delimit masked areas. The center of the group is marked with a red cross. In the top left panel, a group at z = 0.71 with λ⋆ ∼ 78 and central AGN (the same group shown in Fig. 1). In the top right panel, a group at z = 1.29 with λ⋆ ∼ 14. In the bottom left panel, a group at z = 2.22 with λ⋆ ∼ 24 and on the bottom right panel one at z = 3.14 with λ⋆ ∼ 28, flagged for being on the extended X-ray emission of a low-z group and for being at the edge of the field, as visible on the top of the stamp. JWST rgb images are in the same filters as in Fig. 1.
Current usage metrics show cumulative count of Article Views (full-text article views including HTML views, PDF and ePub downloads, according to the available data) and Abstracts Views on Vision4Press platform.
Data correspond to usage on the plateform after 2015. The current usage metrics is available 48-96 hours after online publication and is updated daily on week days.
Initial download of the metrics may take a while.