Fig. 3.
Download original image
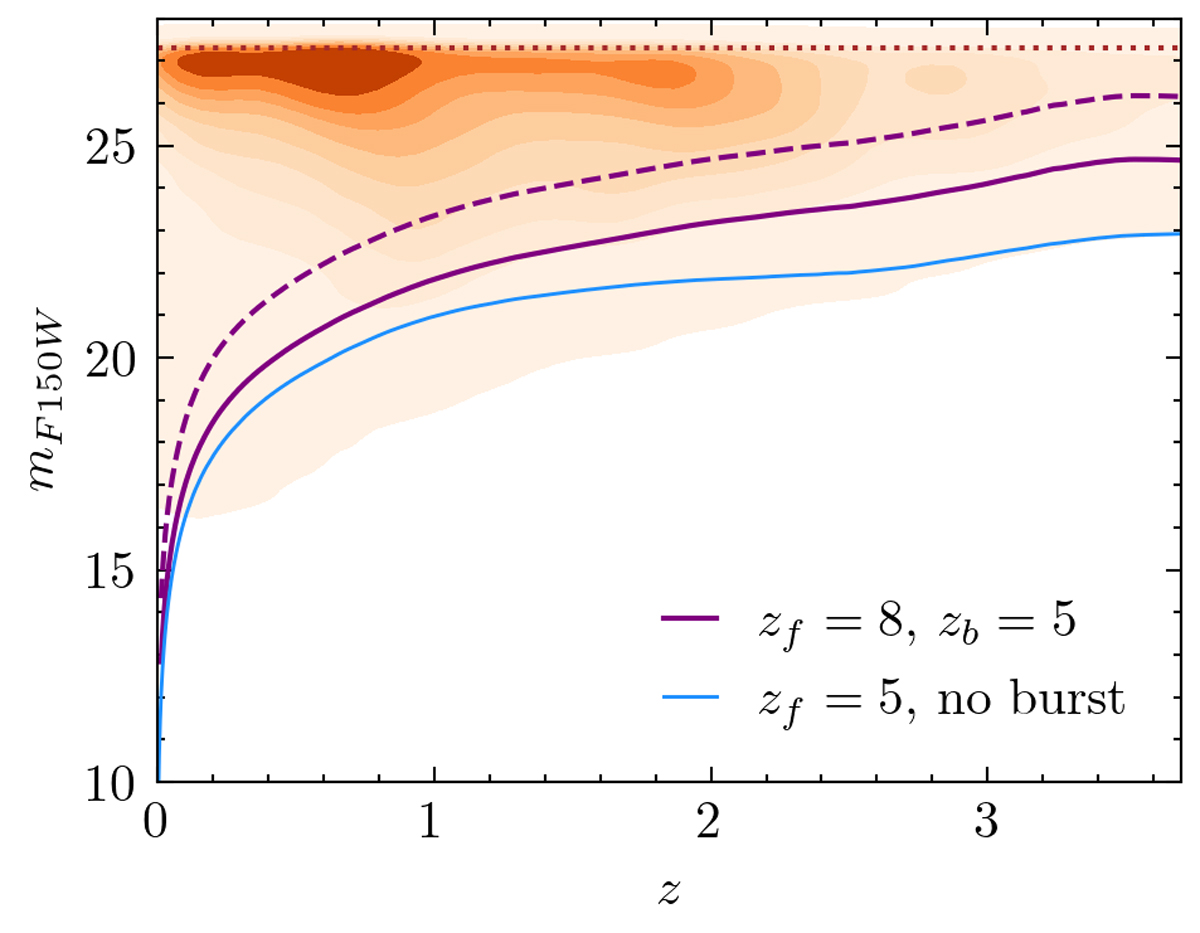
Magnitude and redshift of the galaxies of the input catalog (orange density contours) and evolution with redshift of the characteristic magnitude of the luminosity function, m⋆, for two different models with different formation redshifts and star formation burst, as shown in the legend. The model with zf = 8 and past burst is the one used for the model in this work, marked by the solid purple line. This model better describes the trend of magnitude with respect to the one represented by the solid blue line. The dashed purple line indicates the same model, but for m⋆ + 1.5 which is the limit used in the definition of the intrinsic richness.
Current usage metrics show cumulative count of Article Views (full-text article views including HTML views, PDF and ePub downloads, according to the available data) and Abstracts Views on Vision4Press platform.
Data correspond to usage on the plateform after 2015. The current usage metrics is available 48-96 hours after online publication and is updated daily on week days.
Initial download of the metrics may take a while.