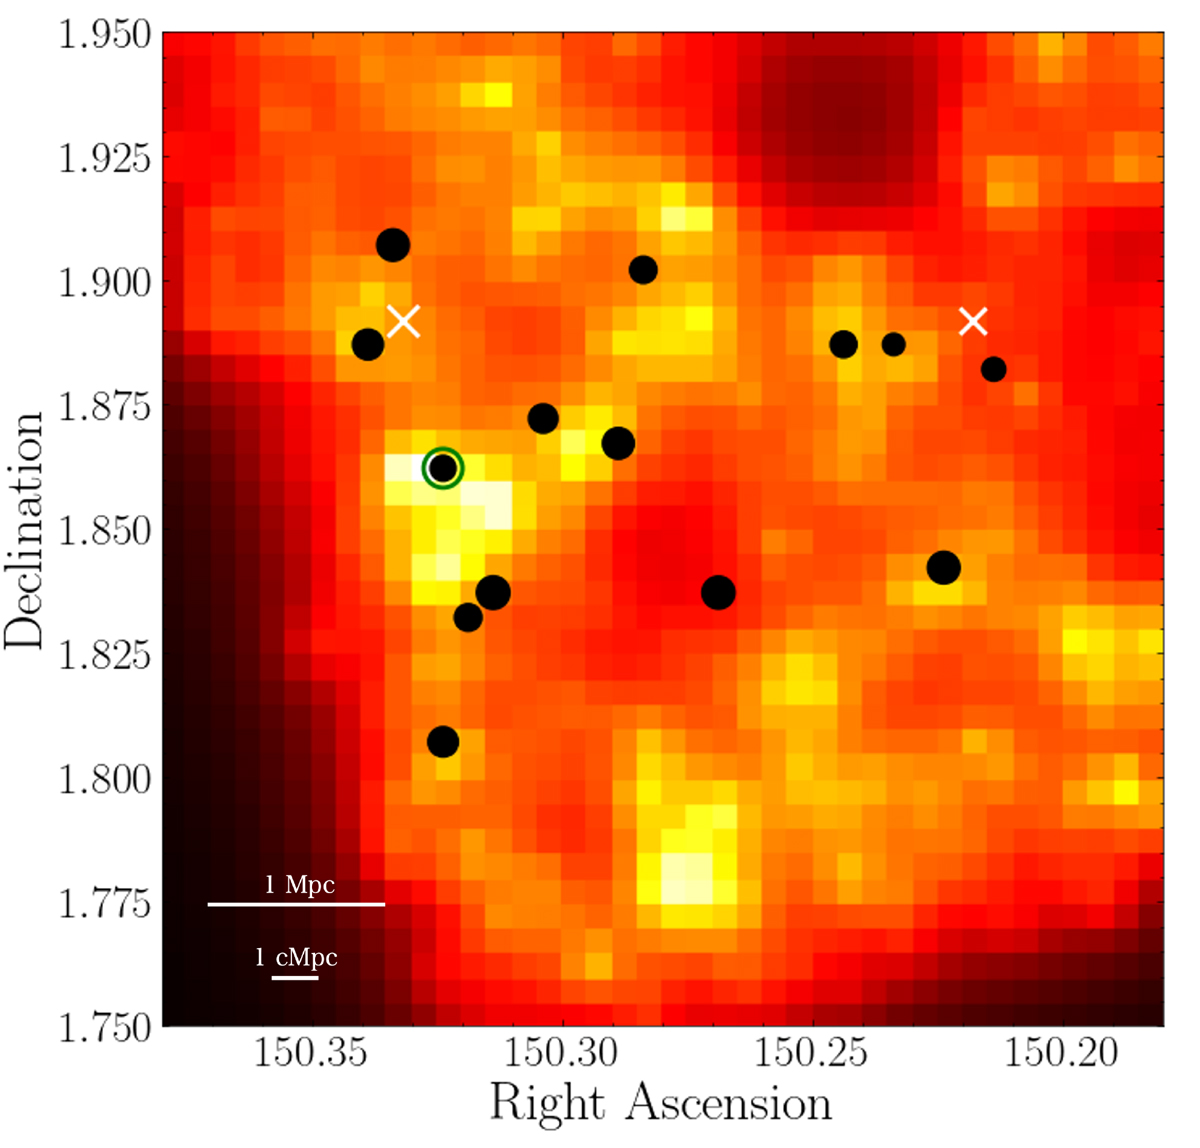
Fig. 14.
Download original image
AmicOne protocluster candidate, consisting of fourteen cores (AMICO detections) with z ∈ [2.5, 3.09] (black points) clustered together in the same large-scale structure, according to our clustering analysis. In the background, the amplitude map returned by AMICO at the redshift slice of the detection marked by the green circle, namely at z = 2.65. Detections (black points) have different redshifts in the range, this is why they are not all lying on an amplitude peak. The amplitude peaks at their individual redshifts. The white crosses mark the position of the protogroups found by Diener et al. (2013). The size of the points is proportional to the redshift.
Current usage metrics show cumulative count of Article Views (full-text article views including HTML views, PDF and ePub downloads, according to the available data) and Abstracts Views on Vision4Press platform.
Data correspond to usage on the plateform after 2015. The current usage metrics is available 48-96 hours after online publication and is updated daily on week days.
Initial download of the metrics may take a while.