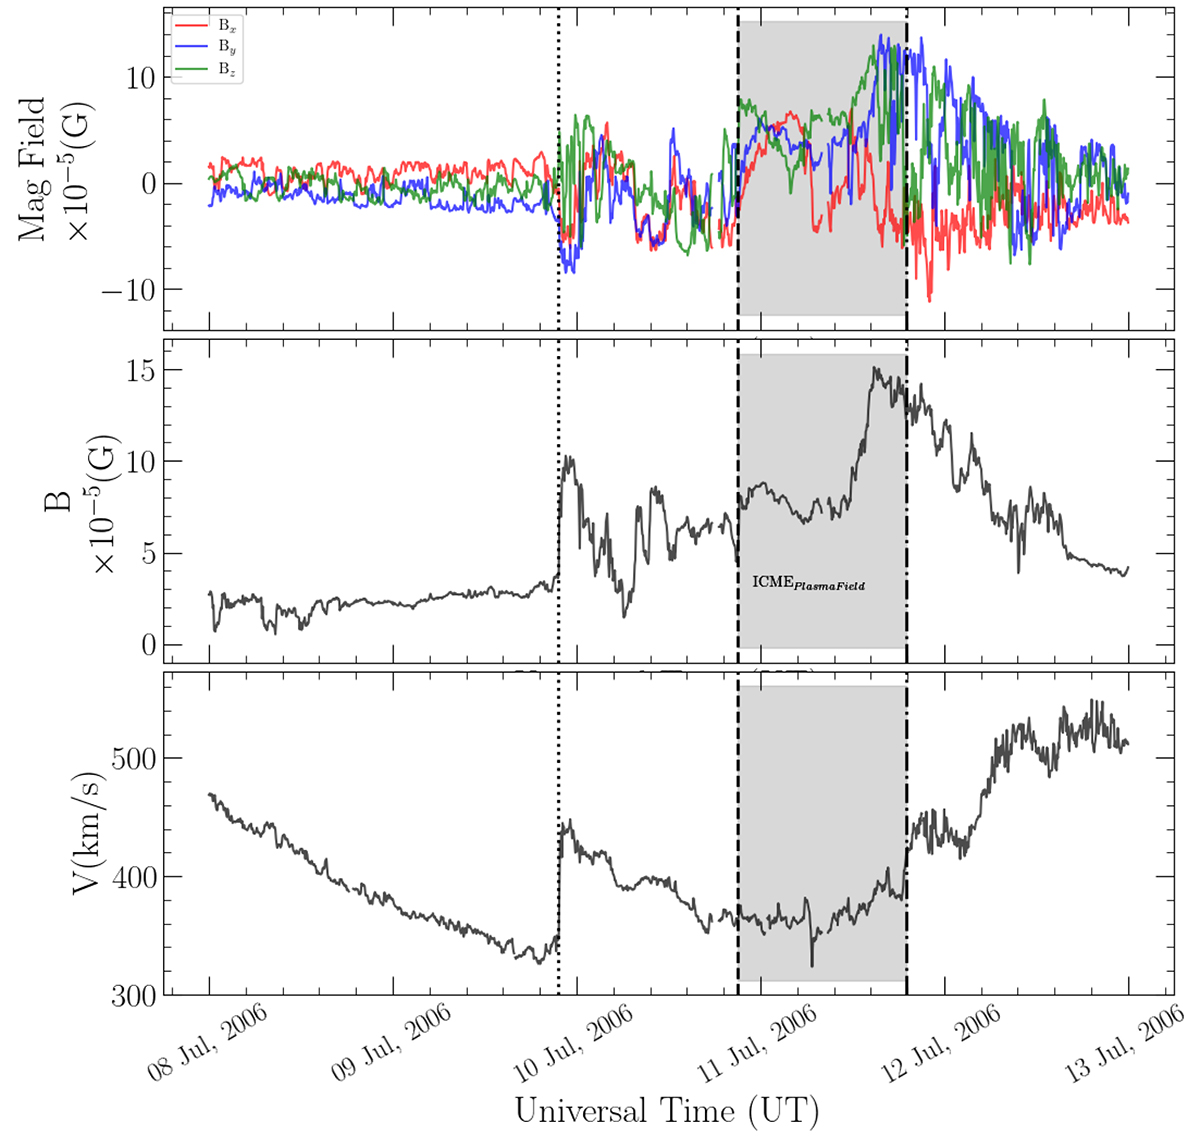
Fig. 2.
Download original image
Associated plot of ICME parameters obtained from Omni data for the type II burst and CME that occurred on 6 July 2006. The top panel illustrates the Bx, By, and Bz vector components of the B field (G); the middle panel shows the average strength of the B field vector (G); and the bottom panel shows the flow speed across the timeline of the event. The vertical dotted line shows the near-Earth shock arrival at 21:36 UT on 9 July 2006 and the grey-shaded region shows the start and end time of the disturbance in the plasma (Richardson & Cane 2010), starting at 19:00 UT on 9 July 2006 and ending at 21:00 UT on 11 July 2006.
Current usage metrics show cumulative count of Article Views (full-text article views including HTML views, PDF and ePub downloads, according to the available data) and Abstracts Views on Vision4Press platform.
Data correspond to usage on the plateform after 2015. The current usage metrics is available 48-96 hours after online publication and is updated daily on week days.
Initial download of the metrics may take a while.