Fig. C.1.
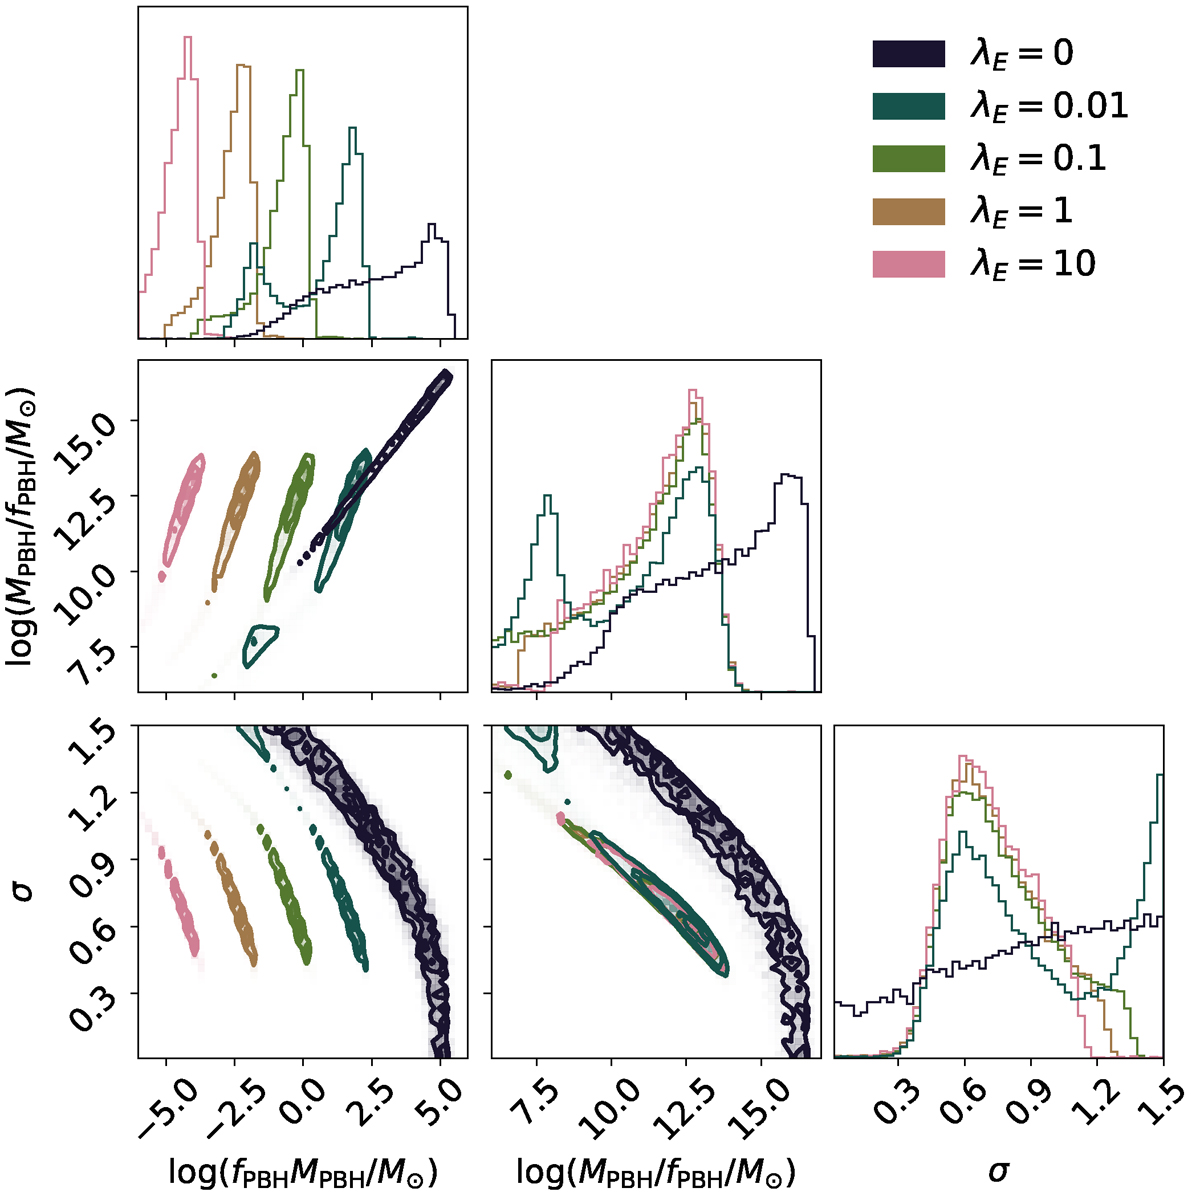
Download original image
Alternative corner plot of the posterior for the PBH models (Sec. 2). Parameters resulting from the MCMC procedure (see Fig. B.1 and Tab. 1) have been recombined in the form of log(fPBHMPBH/M⊙) and log(MPBH/fPBH/M⊙). Each color corresponds to a value for λE, as reported in the legend. Tabulated results are reported in Tab. C.1.
Current usage metrics show cumulative count of Article Views (full-text article views including HTML views, PDF and ePub downloads, according to the available data) and Abstracts Views on Vision4Press platform.
Data correspond to usage on the plateform after 2015. The current usage metrics is available 48-96 hours after online publication and is updated daily on week days.
Initial download of the metrics may take a while.