Open Access
Fig. A.1.
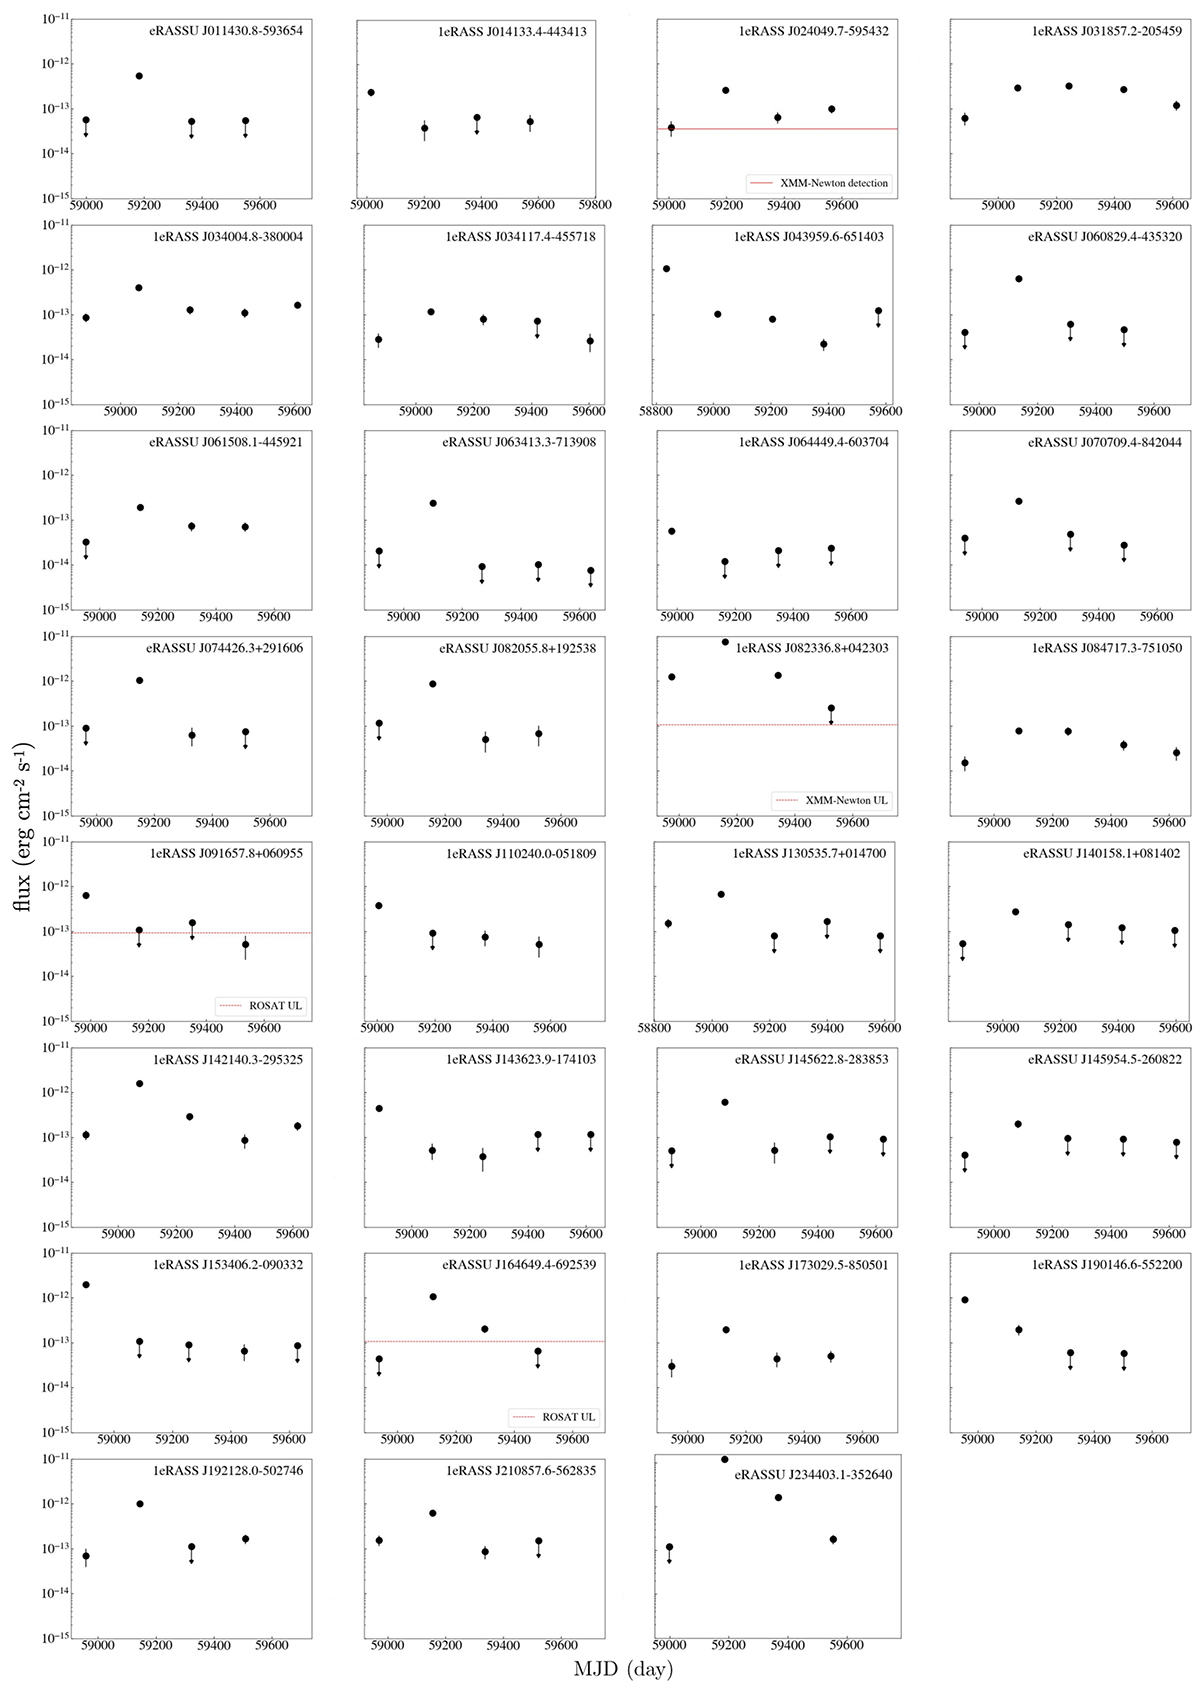
Download original image
eRASS1-4(5) eROSITA X-ray light curves for the TDE sample in 0.2-2.3 keV. The red dashed and solid lines denote archival ULs and detections, respectively.
Current usage metrics show cumulative count of Article Views (full-text article views including HTML views, PDF and ePub downloads, according to the available data) and Abstracts Views on Vision4Press platform.
Data correspond to usage on the plateform after 2015. The current usage metrics is available 48-96 hours after online publication and is updated daily on week days.
Initial download of the metrics may take a while.