Fig. 5.
Download original image
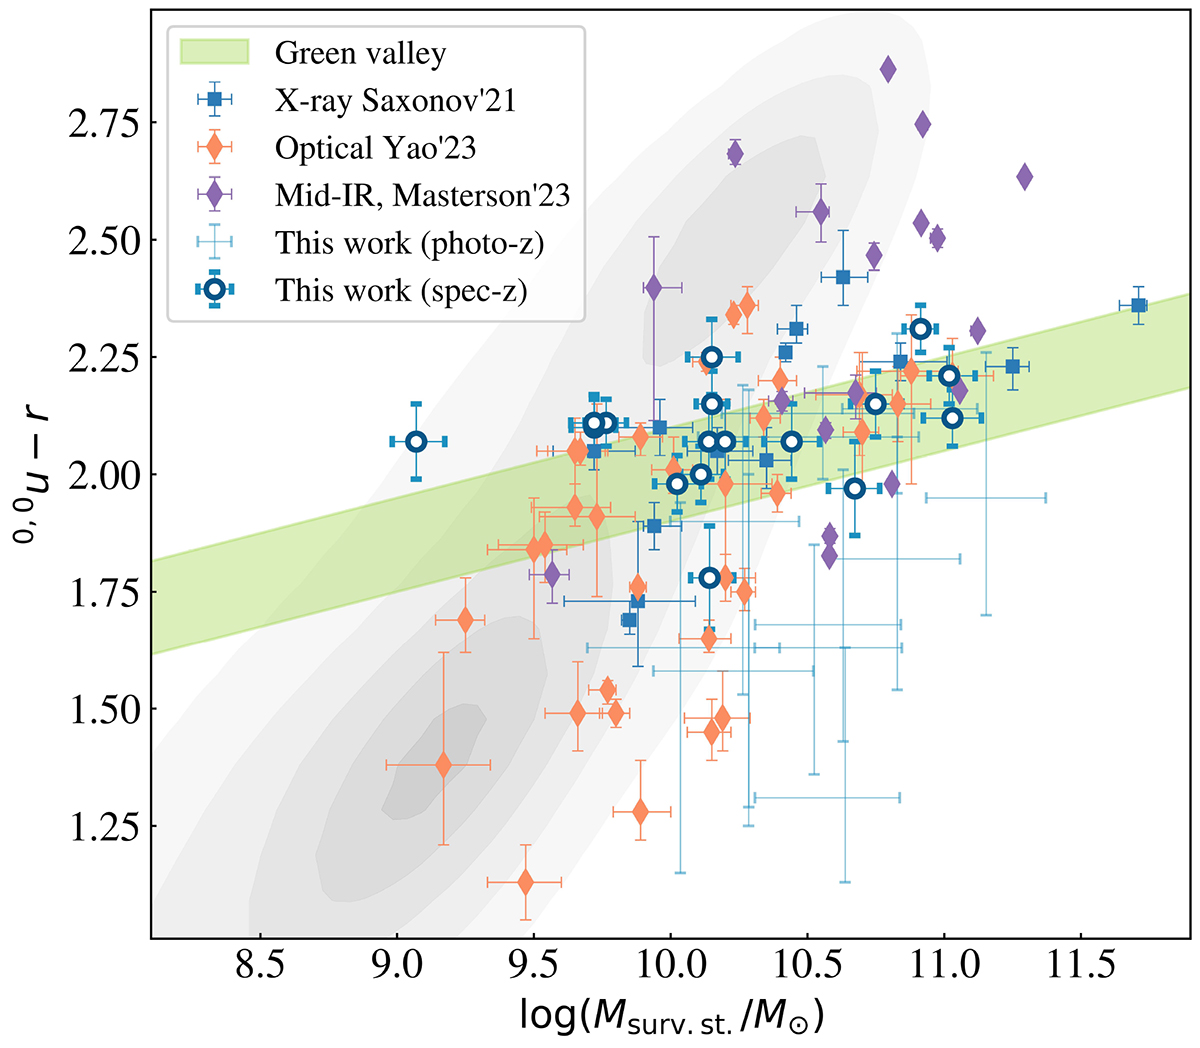
Host-galaxy color versus surviving stellar mass of the eROSITA TDE sample in comparison to other TDE samples selected in X-rays, the optical, and the mid-IR. Gray contours denote a sample of SDSS galaxies within the same redshift range (z<0.34) from Mendel et al. (2014). The green area shows the green valley defined in Yao et al. (2023). The blue circles show the eROSITA TDEs presented in this work with spec-z, and sources with photo-z are shown with blue error bars. The errors for sources with photo-z are calculated accounting for 1σ photo-z errors. The orange and purple diamonds and blue squares denote TDE samples selected in the optical (Yao et al. 2023) and mid-IR (Masterson et al. 2024) and in X-rays (Sazonov et al. 2021), respectively.
Current usage metrics show cumulative count of Article Views (full-text article views including HTML views, PDF and ePub downloads, according to the available data) and Abstracts Views on Vision4Press platform.
Data correspond to usage on the plateform after 2015. The current usage metrics is available 48-96 hours after online publication and is updated daily on week days.
Initial download of the metrics may take a while.