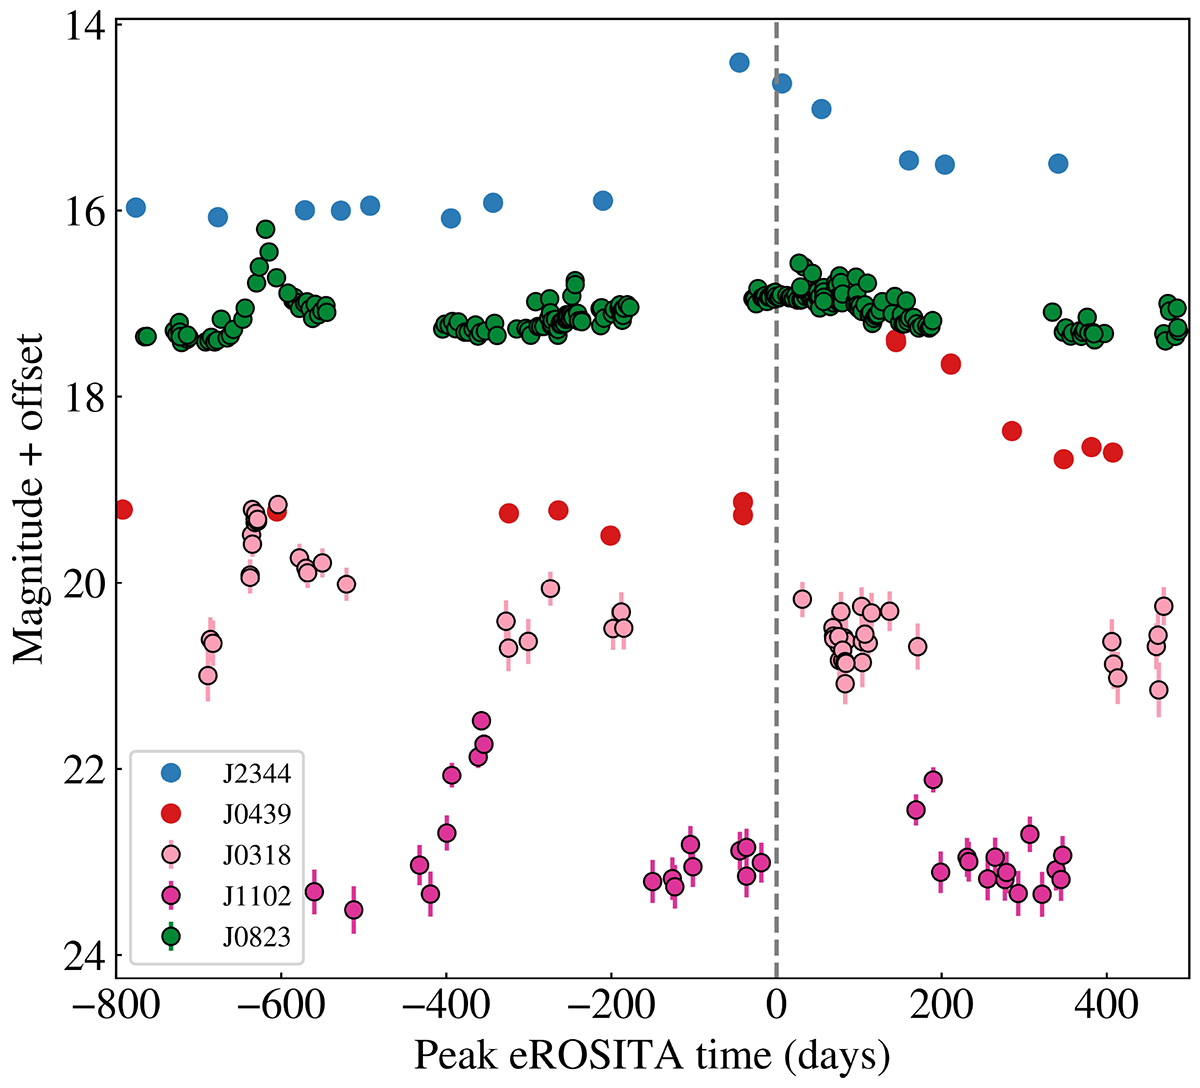
Fig. 4.
Download original image
Non-host-subtracted g-band light curves of five TDE candidates showing significant optical flares. The x-axis shows time after eROSITA peak in days, so x = 0 corresponds to the peak eROSITA detection for each source. The summary of observational information is provided in Table C.1. The individual-host-subtracted light curves are showin in Fig. C.3. The optical flare of J0744 is too faint to be distinguished in a non-host-subtracted light curve and is only shown in the host-subtracted plot.
Current usage metrics show cumulative count of Article Views (full-text article views including HTML views, PDF and ePub downloads, according to the available data) and Abstracts Views on Vision4Press platform.
Data correspond to usage on the plateform after 2015. The current usage metrics is available 48-96 hours after online publication and is updated daily on week days.
Initial download of the metrics may take a while.