Open Access
Fig. C.3.
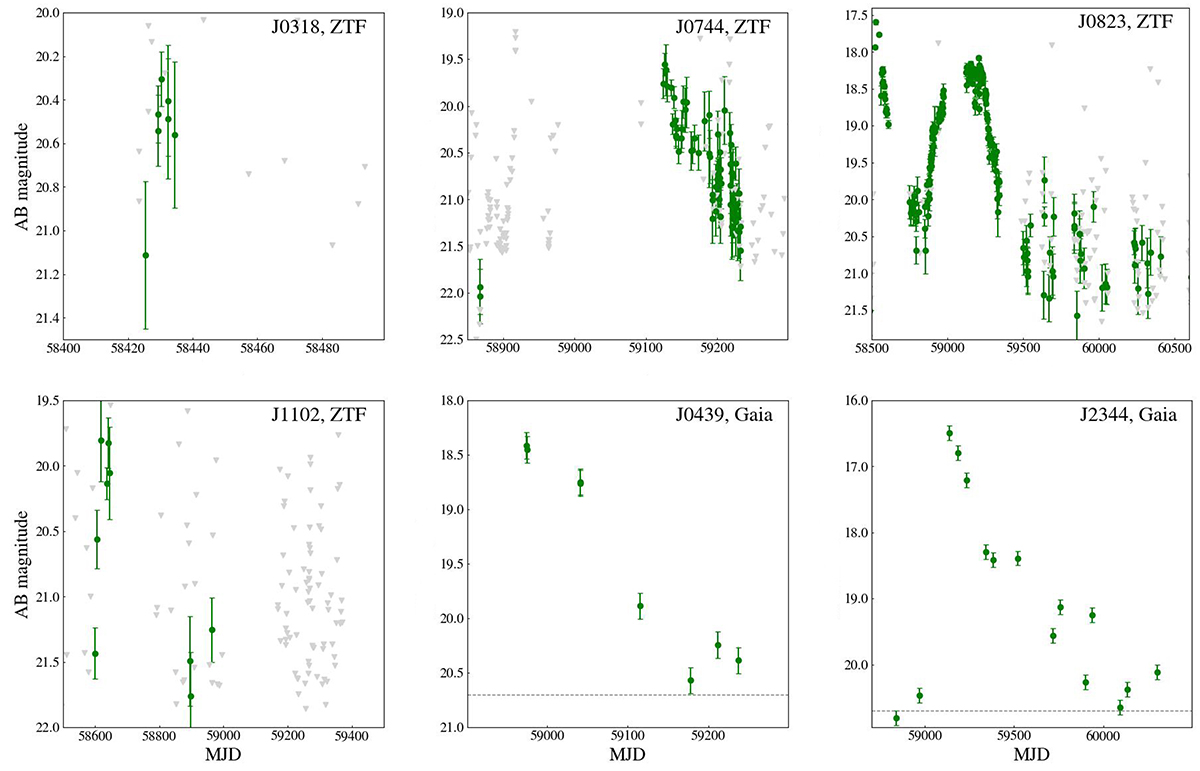
Download original image
Host-subtracted light curves of optical flares of six sources from the TDE sample in g band. Gray triangles denote upper limits in ZTF light curves. Gray dashed lines show the Gaia detection limit of 20.7 mag (Hodgkin et al. 2021).
Current usage metrics show cumulative count of Article Views (full-text article views including HTML views, PDF and ePub downloads, according to the available data) and Abstracts Views on Vision4Press platform.
Data correspond to usage on the plateform after 2015. The current usage metrics is available 48-96 hours after online publication and is updated daily on week days.
Initial download of the metrics may take a while.