Fig. 1.
Download original image
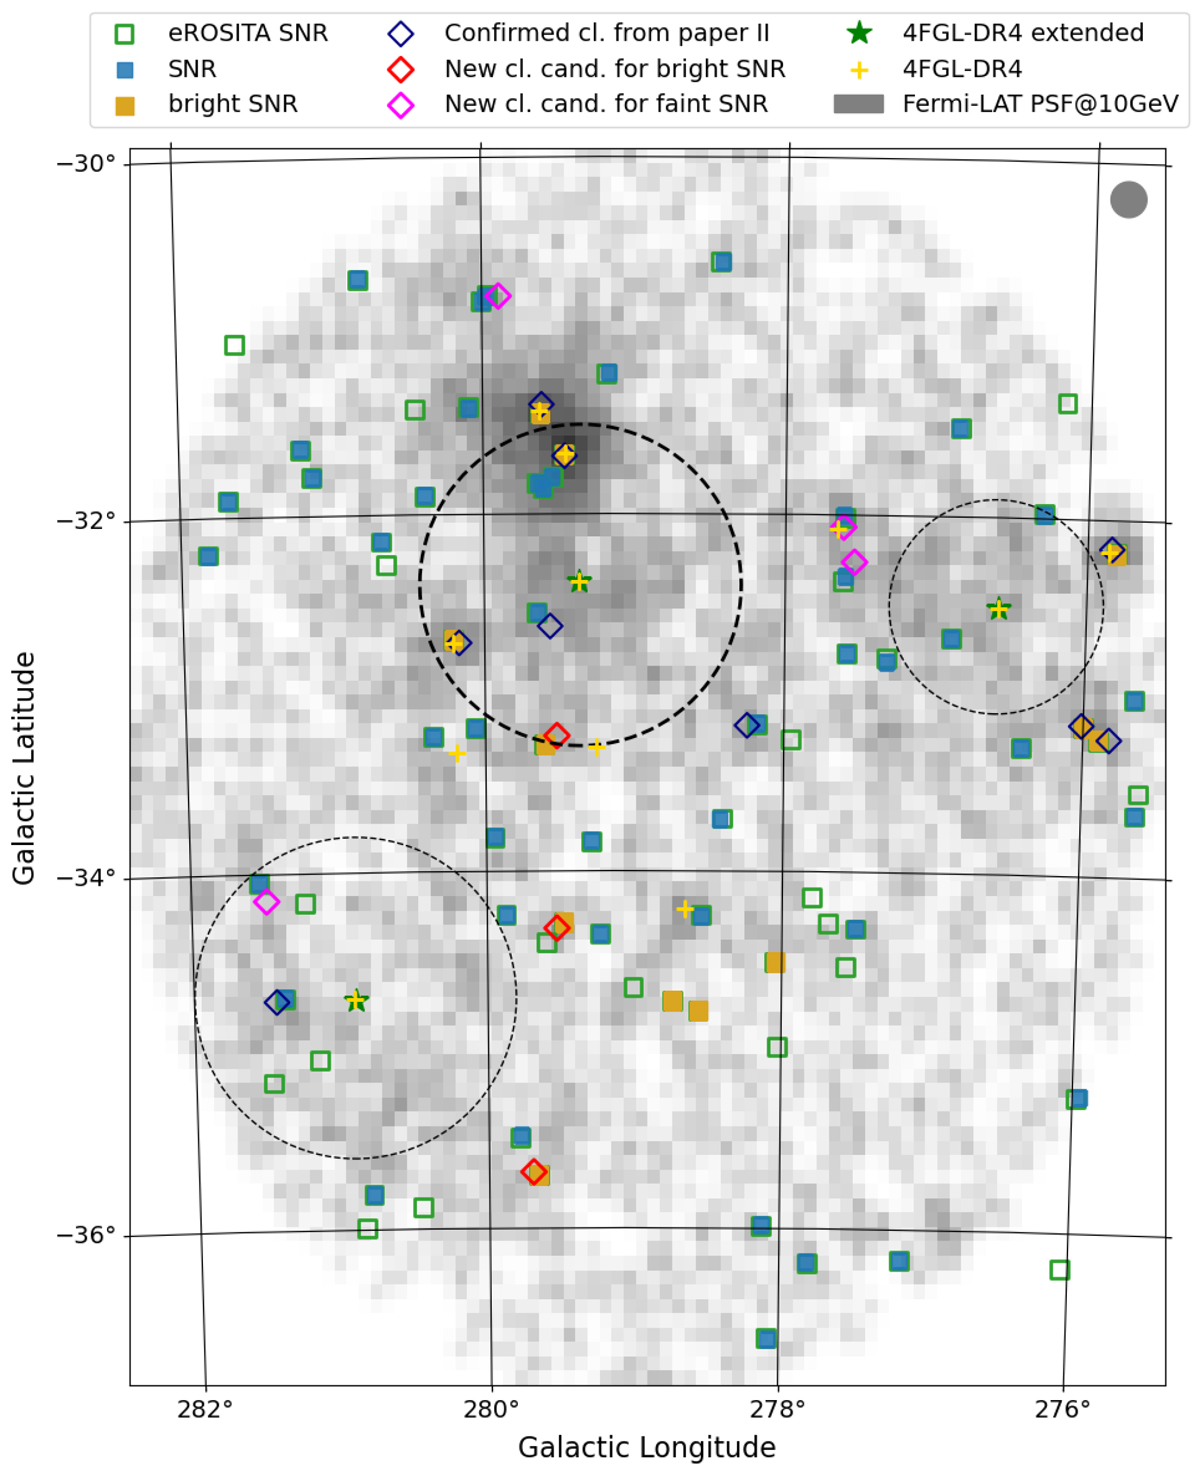
Map of the region of the LMC reporting the known SNRs, 4FGL-DR4 sources, and the photon clusters found in the present work. Solid squares identify SNRs from Maggi et al. (2016). Green empty squares identify SNRs from Zangrandi et al. (2024). Blue diamonds identify confirmed clusters form Campana et al. (2016c), and red and purple diamonds identify clusters detected in the present analysis for bright and faint SNRs, respectively. Yellow crosses mark 4FGL-DR4 point-like sources, dashed circles represent the approximate size of the extended 4FGL sources, the thick circle is that containing the 30 Dor complex, and green stars mark their centers.
Current usage metrics show cumulative count of Article Views (full-text article views including HTML views, PDF and ePub downloads, according to the available data) and Abstracts Views on Vision4Press platform.
Data correspond to usage on the plateform after 2015. The current usage metrics is available 48-96 hours after online publication and is updated daily on week days.
Initial download of the metrics may take a while.