Fig. 1.
Download original image
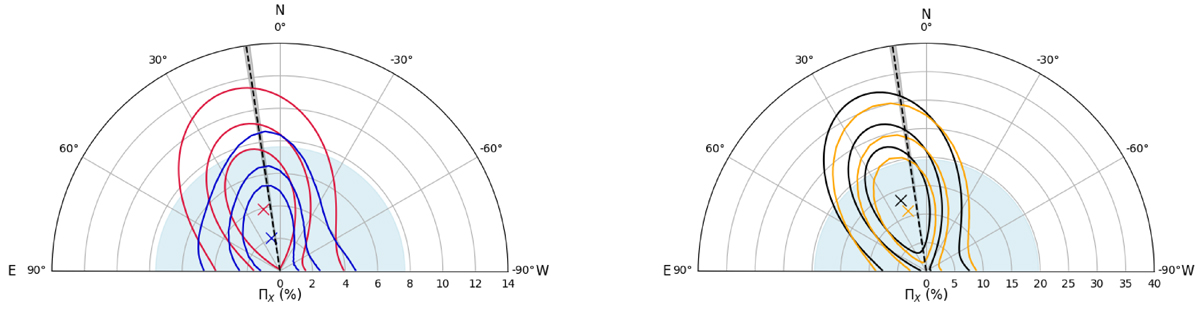
Left panel: The contour plots between ΠX and ΨX measured in the 2–8 keV band using the PCUBE (red) and XSPEC (blue) analyses. The red and blue crosses are the best-fitted values of ΠX and ΨX. The contours are plotted in 68% (χ2 = 2.28), 90% (χ2 = 4.605) and 99% (χ2 = 9.21) confidence levels. Right panel: The polarization degree ΠX and polarization angle ΨX contour plots as obtained from the 5.66–8 keV PCUBE (black) and XSPEC (orange) analyses. The black and orange crosses are the best-fitted values of ΠX and ΨX. The contours are plotted in 68% (χ2 = 2.28), 90% (χ2 = 4.605) and 99% (χ2 = 9.21) confidence. The black dashed line represents the radio jet position angle (∼8.5°) of NGC 2110. The black shaded region is the error in jet position angle. The blue shaded regions denote the MDP99 value at the 99% confidence.
Current usage metrics show cumulative count of Article Views (full-text article views including HTML views, PDF and ePub downloads, according to the available data) and Abstracts Views on Vision4Press platform.
Data correspond to usage on the plateform after 2015. The current usage metrics is available 48-96 hours after online publication and is updated daily on week days.
Initial download of the metrics may take a while.