Fig. 9
Download original image
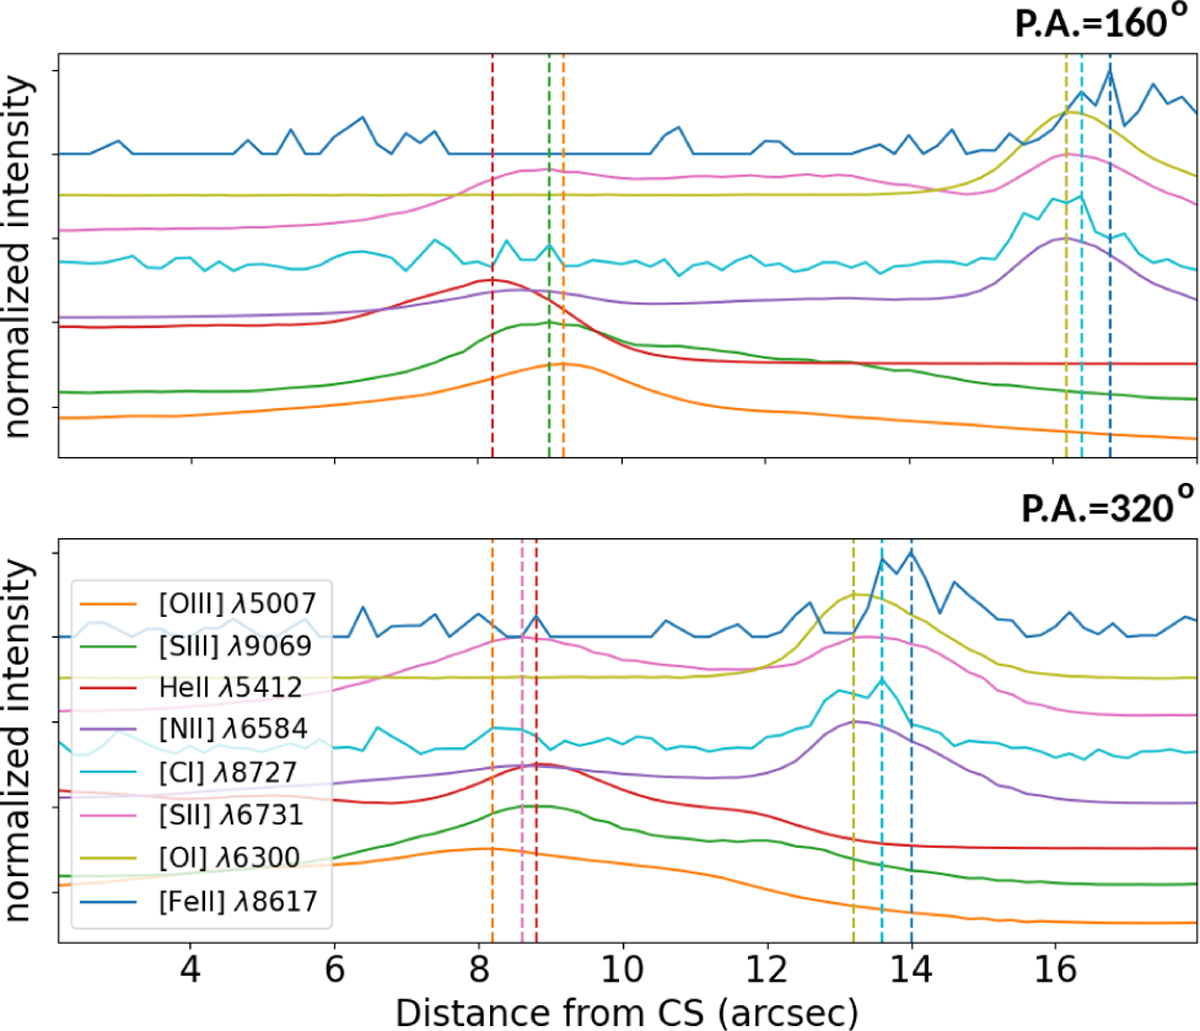
Radial profiles of some typical optical emission lines for PA = 160° (top panel) and PA = 320° (bottom panel). The line intensities are normalized and an offset of 0.5 has been applied between the lines. The dashed lines define the pick intensities. There is an overlap in the picks of [N II], [S II] and [C I] for both PA and between [S III] and the first pick of [S II] only for PA = 360°.
Current usage metrics show cumulative count of Article Views (full-text article views including HTML views, PDF and ePub downloads, according to the available data) and Abstracts Views on Vision4Press platform.
Data correspond to usage on the plateform after 2015. The current usage metrics is available 48-96 hours after online publication and is updated daily on week days.
Initial download of the metrics may take a while.