Open Access
Fig. 6
Download original image
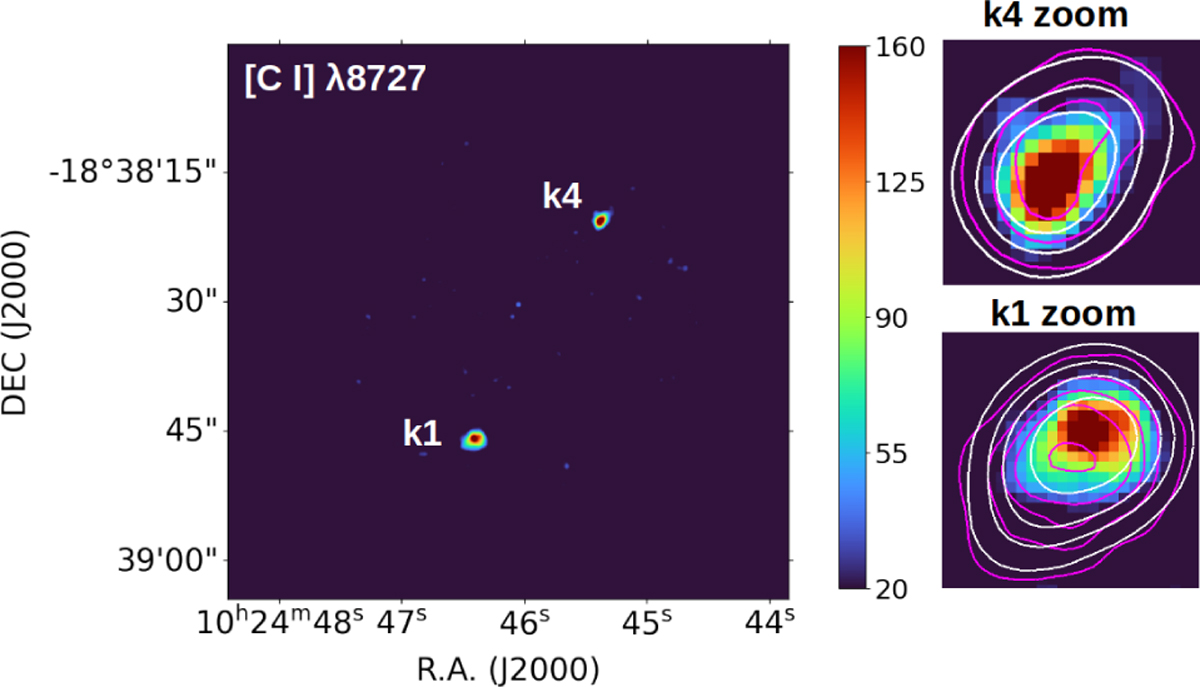
Detection of [C I] λ8727 at k1 and k4 LISs. The zoomed in figures show also the contours for the [O I] λ6300 (white) and [N I] λλ5198,5200 (magenta) emission lines. The images are smoothed with σ = 1.5. The color bar represents the values of the pixels (in flux units ×10−20 erg s−1 cm−2 spaxel−1).
Current usage metrics show cumulative count of Article Views (full-text article views including HTML views, PDF and ePub downloads, according to the available data) and Abstracts Views on Vision4Press platform.
Data correspond to usage on the plateform after 2015. The current usage metrics is available 48-96 hours after online publication and is updated daily on week days.
Initial download of the metrics may take a while.