Fig. 3
Download original image
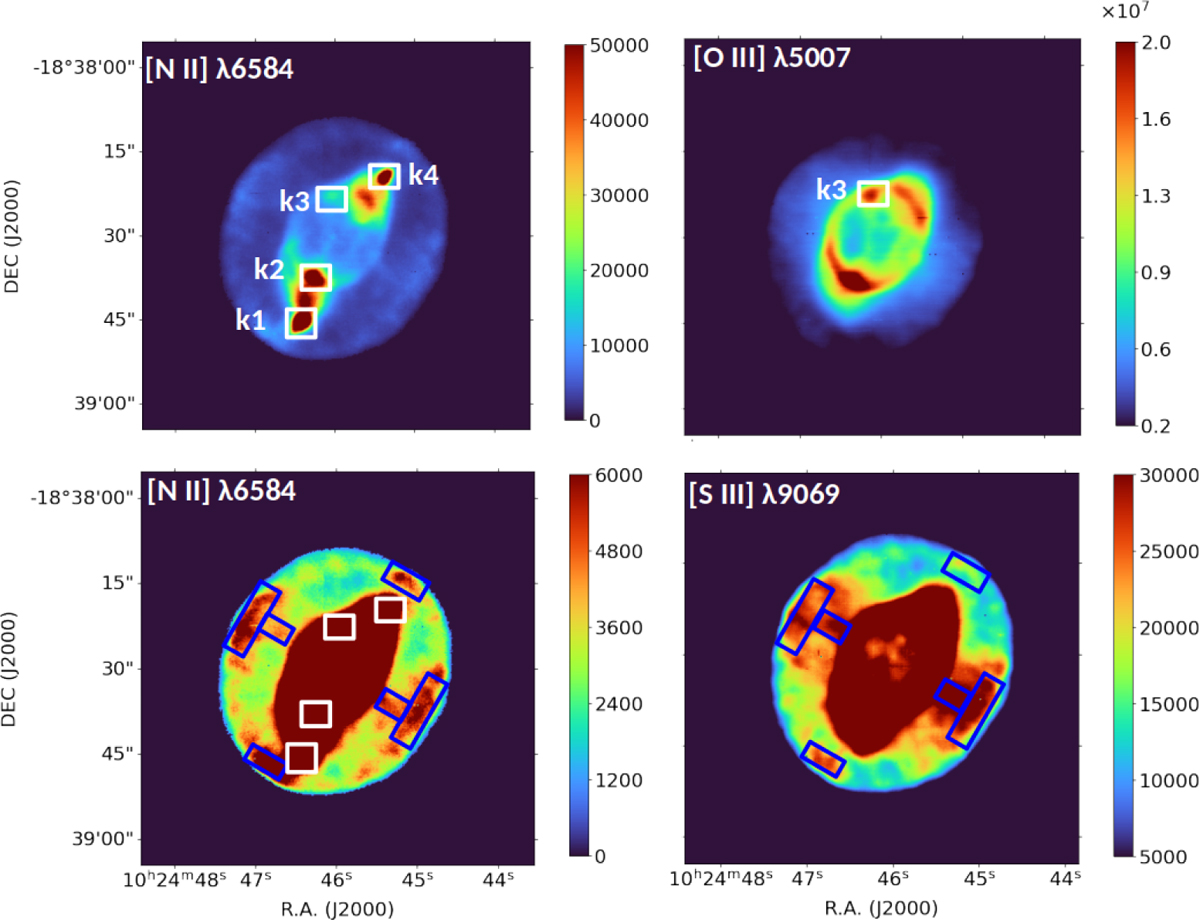
Emission line maps of [N II] λ6584 (top left and bottom left), [O III] λ5007 (top right), and [S III] λ9069 (bottom right) for NGC 3242. In the top panels, the four knots are marked. The bottom high-contrast images show the new structures at the nebular shell (blue rectangles), while in the bottom-left, the four knots are marked as well (white rectangles). The color bar represent flux values (in units of ×10−20 erg s−1 cm−2 spaxel−1).
Current usage metrics show cumulative count of Article Views (full-text article views including HTML views, PDF and ePub downloads, according to the available data) and Abstracts Views on Vision4Press platform.
Data correspond to usage on the plateform after 2015. The current usage metrics is available 48-96 hours after online publication and is updated daily on week days.
Initial download of the metrics may take a while.