Open Access
Fig. 2
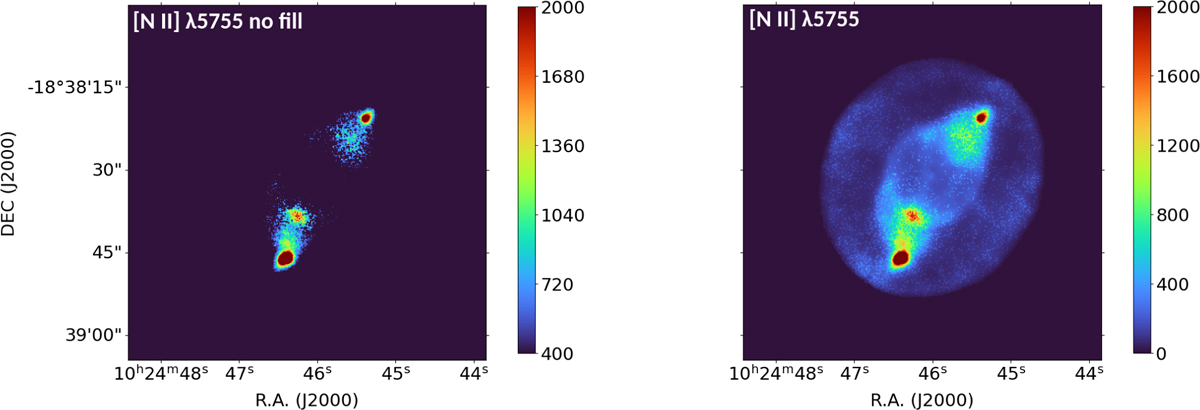
Download original image
Emission line maps of [N II] λ5755. The left panel illustrates the map after masking the pixels with low S/N, while in the right one is the final map that we used. The color bar represents pixel values (in terms of flux units ×10−20 erg s−1 cm−2 spaxel−1).
Current usage metrics show cumulative count of Article Views (full-text article views including HTML views, PDF and ePub downloads, according to the available data) and Abstracts Views on Vision4Press platform.
Data correspond to usage on the plateform after 2015. The current usage metrics is available 48-96 hours after online publication and is updated daily on week days.
Initial download of the metrics may take a while.