Fig. 14
Download original image
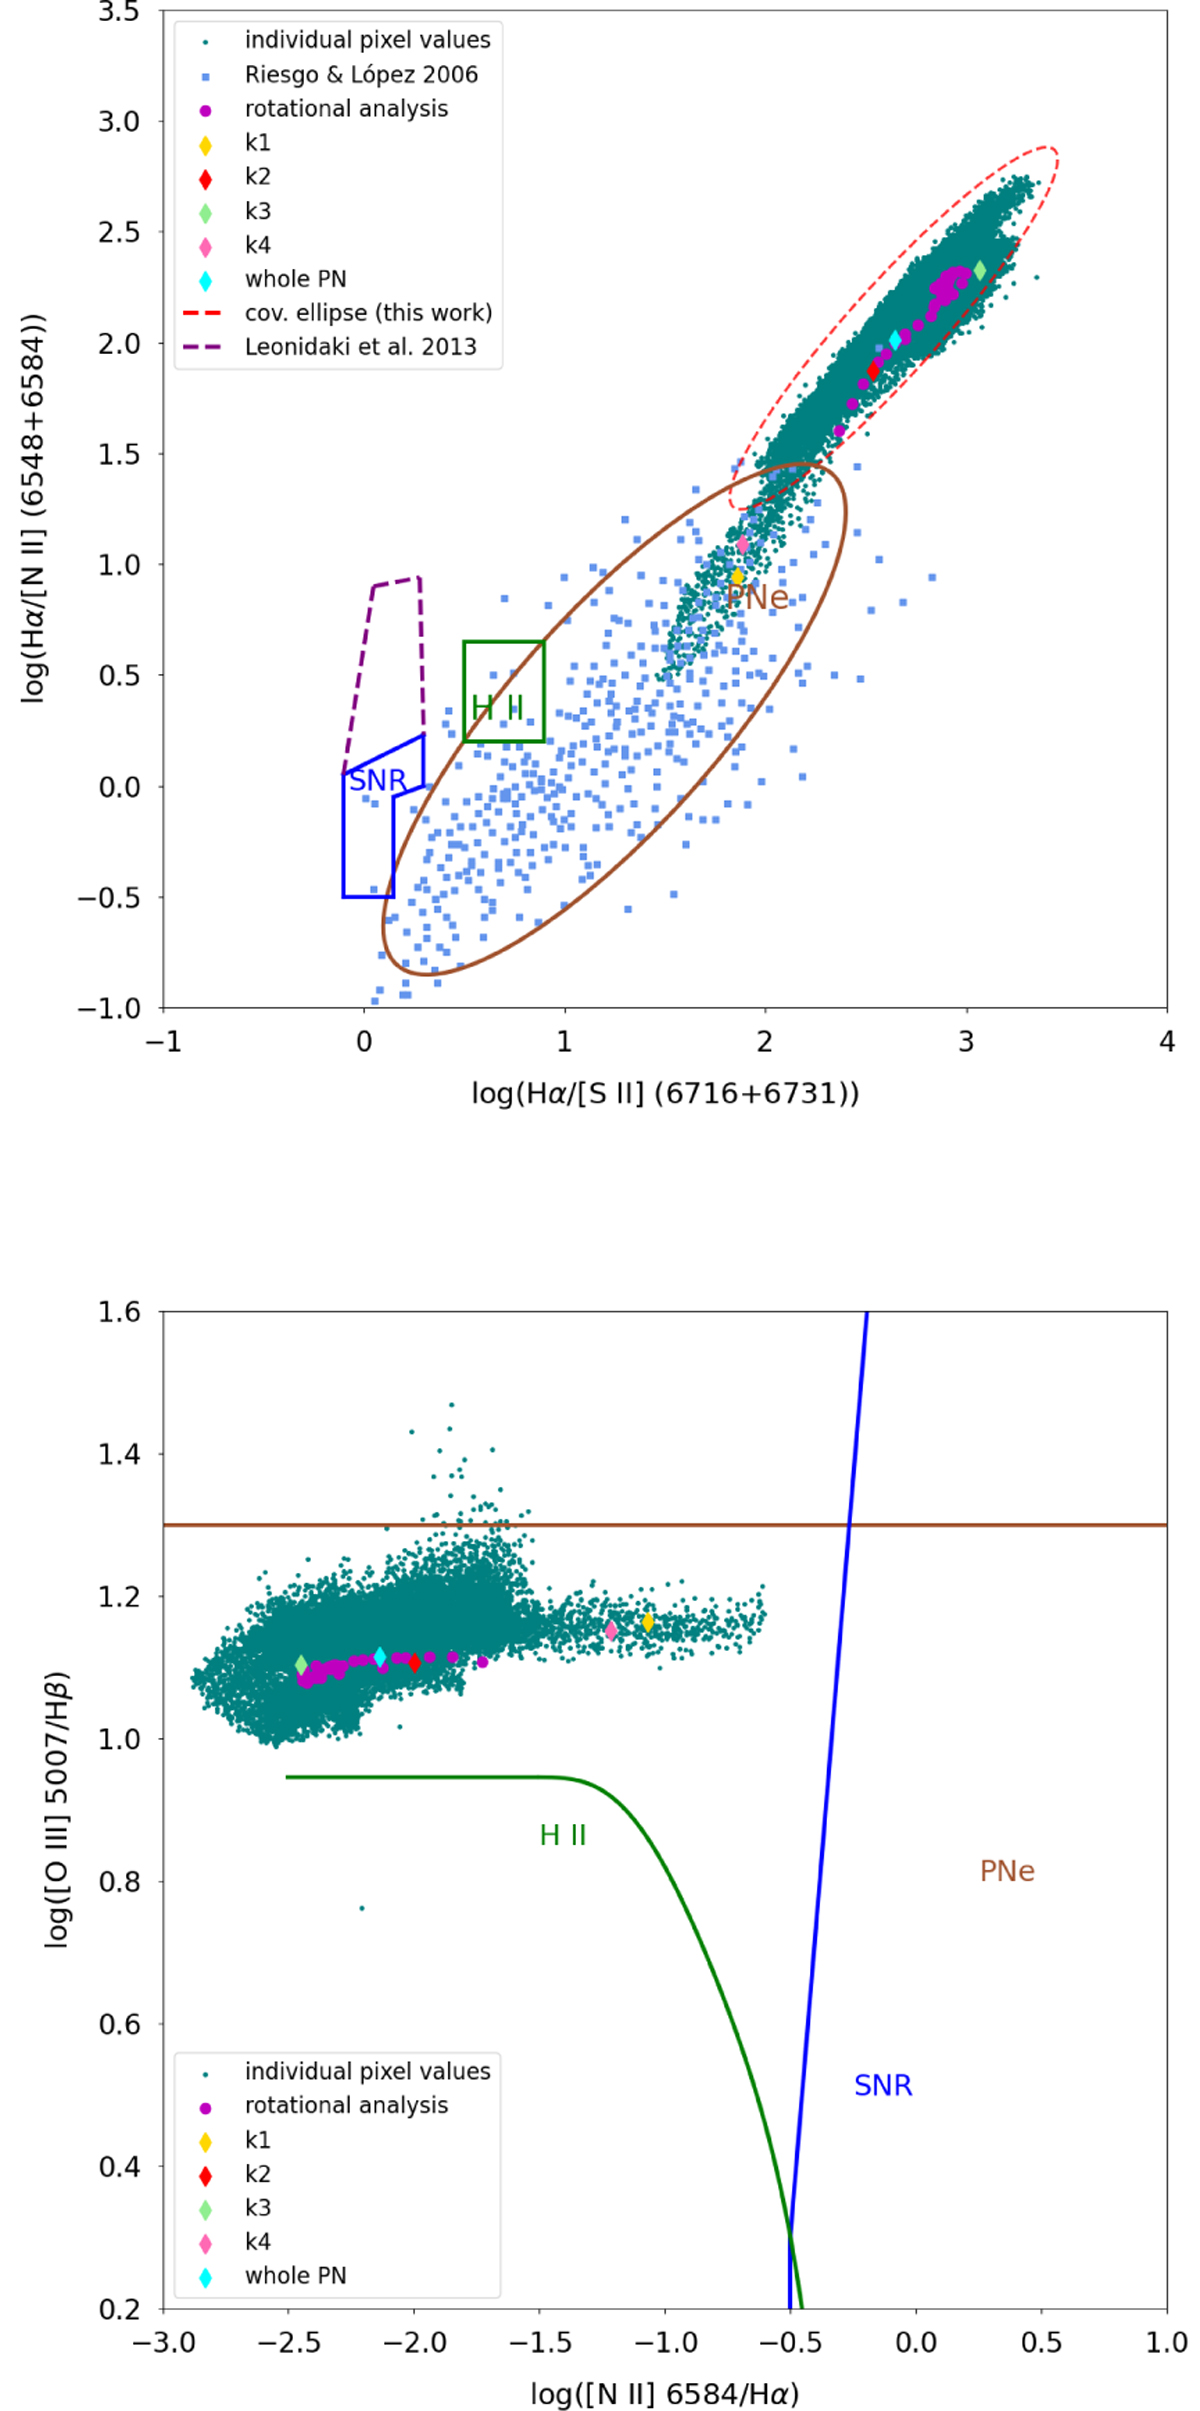
Upper panel: log(Hα/[N II] (6548+6584)) versus log(Hα/[S II] (6716+6731)). Lower panel: log([O III] (4959+5007)/Hβ) versus log([N II] (6548+6584)/Hα). The brown, blue+purple and green regions define the positions of PNe, SNRs, and H II regions, respectively (Leonidaki et al. 2013; Riesgo & López 2006). The cyan dots are data points from the spaxel-by-spaxel analysis, the diamonds correspond to results from the specific slit analysis, and the pink dots indicate the findings from the rotational analysis. In the upper panel, the red dotted ellipse extends the PNe region to include the higher ionization PNe such as NGC 3242.
Current usage metrics show cumulative count of Article Views (full-text article views including HTML views, PDF and ePub downloads, according to the available data) and Abstracts Views on Vision4Press platform.
Data correspond to usage on the plateform after 2015. The current usage metrics is available 48-96 hours after online publication and is updated daily on week days.
Initial download of the metrics may take a while.