Table 3.
List of the bivariate features used in this work grouped under the families introduced in Sect. 3.2 (Tschopp & Hernandez-Rivera 2017).
| Minkowski family | |
|---|---|
| City_Block, L1-norm | dCity = ∑|gi − ri| |
| Euclidean, L2-norm | 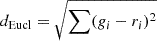 |
| Chebyshev, L∞-norm | dCv = maxi|gi − ri| |
| L1 family | |
| Sørensen | 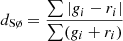 |
| Gower | dGw = ∑|gi − ri|/b |
| Kulczynski | 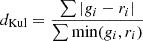 |
| Canberra | 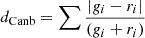 |
| Lorentzian | dLor = ∑ln(1 + |gi − ri|) |
| Intersection family | |
| Intersection | dIs = ∑|gi − ri|/2 |
| Wave_Hedges | 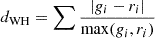 |
| Motyka | 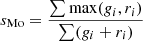 |
| Czekanowski | 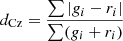 |
| Ruzicka | 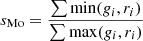 |
| Inner product family | |
| Inner_Product | sIp = ∑giri |
| Harmonic_Mean | 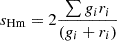 |
| Cosine | 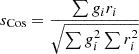 |
| Jaccard | 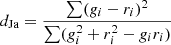 |
| Dice |  |
| Fidelity family | |
| Fidelity | 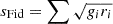 |
| Bhattacharyya | 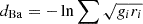 |
| Squared-chord | 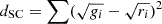 |
| χ2 family | |
| Squared_Euclidean | dSE = ∑(gi − ri)2 |
| Pearson χ2 | dPea = ∑(gi − ri)2/ri |
| Neyman χ2 | dNey = ∑(gi − ri)2/gi |
| χ2 | 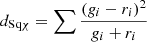 |
| Divergence | 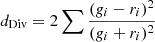 |
| Clark | ![$ d_{\text{Cl}}= \sqrt{\sum\left[\frac{|g_i - r_i|}{(g_i + r_i)}\right]^2} $](/articles/aa/full_html/2025/05/aa53630-24/aa53630-24-eq19.gif) |
| Additive_Symmetric χ2 | 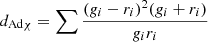 |
| Shannon’s entropy family | |
| Kullback-Leibler | dKL = ∑giln(gi/ri) |
| Jeffreys | dJef = ∑(gi − ri)ln(gi/ri) |
| K-divergence | dKdv = ∑giln(2gi/(gi + ri)) |
| Topsøe | 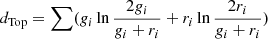 |
| −(gi + ri)/2 * ln((gi + ri)/2)) | |
| Combination family | |
| Taneja | 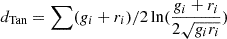 |
| Kumar-Johnson |  |
| Average(L1-L∞) | davL = ∑(|gi − ri|+maxi|gi − ri|)/2 |
| Vicissitude family | |
| Vicis-Wave_Hedges | dVwh = ∑|gi − ri|/min(gi, ri) |
| Vicis-Symmetric χ32 | dvsχ32 = ∑(gi − ri)2/max(gi, ri) |
| Max-Symmetric χ2 | dMaxS = max(∑(gi − ri)2/gi, ∑(gi − ri)2/ri) |
| Min-Symmetric χ2 | dMinS = min(∑(gi − ri)2/gi, ∑(gi − ri)2/ri) |
Notes. The functions used to compute distance or similarity measures require vectors X and Y (in this case, the g- and r-band light curves) and return the corresponding similarities or distances per the various measures given above.
Current usage metrics show cumulative count of Article Views (full-text article views including HTML views, PDF and ePub downloads, according to the available data) and Abstracts Views on Vision4Press platform.
Data correspond to usage on the plateform after 2015. The current usage metrics is available 48-96 hours after online publication and is updated daily on week days.
Initial download of the metrics may take a while.