Fig. 9
Download original image
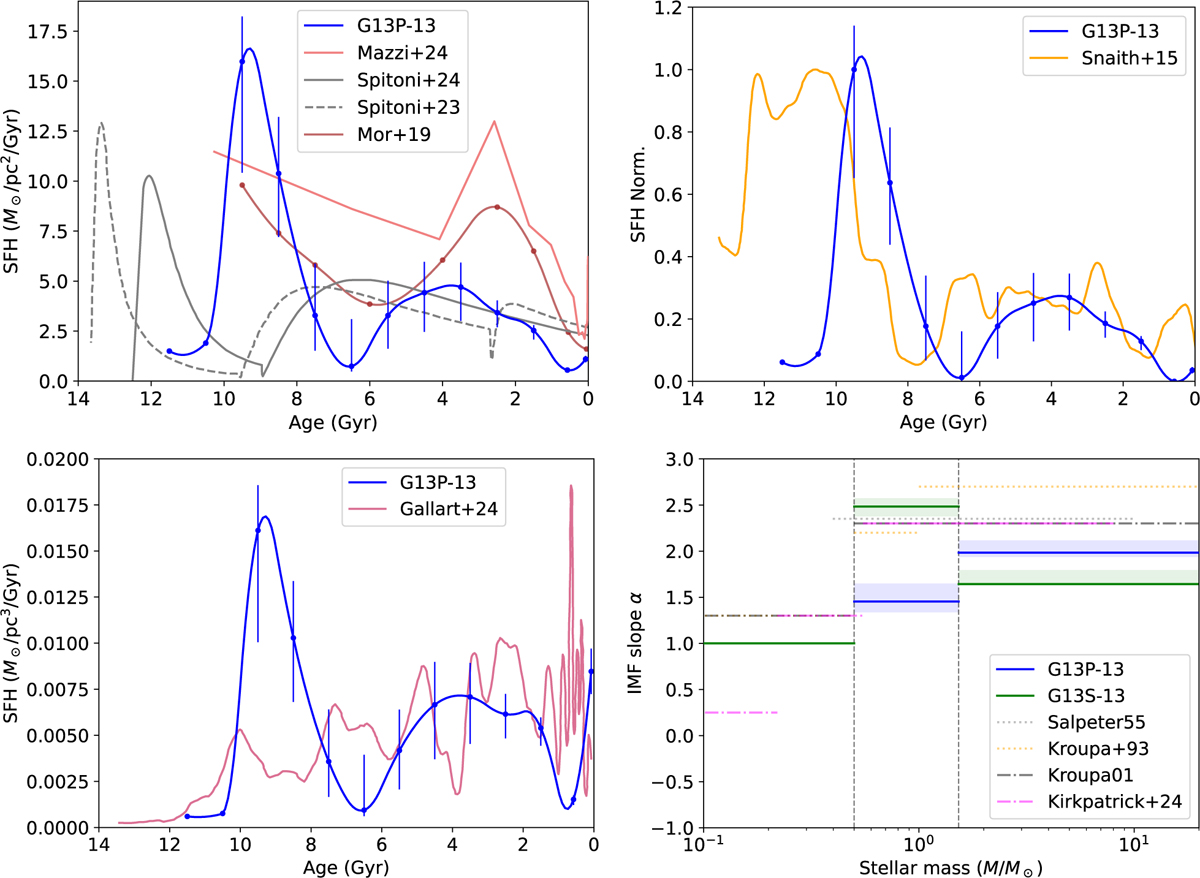
Comparison of our inferred SFH and IMFs with the literature. Top left: comparison of our fiducial solution G13P-13 with the results from Mazzi et al. (2024), Spitoni et al. (2024), Spitoni et al. (2023), and Mor et al. (2019), all presented in original units (surface density). The error bars of our SFH and IMFs correspond to the 16th and 84th percentiles of the marginalised posterior PDFs of each parameter, whose values can be found in Table 2. Top right: findings of Snaith et al. (2015) contrasted with our fiducial solution normalised to the maximum value of each SFH. Bottom left: Comparison of the solution of our execution G13P-13 with the SFH from Gallart et al. (2024), presented in terms of volume density. To convert our surface densities to volume densities we employed the scale heights of each population in BGM. Bottom right: slopes of the IMFs derived in executions G13P-13 and G13S-13 alongside those from Salpeter (1955), Kroupa et al. (1993) (assumed in Gallart et al. 2024), Kroupa (2001), and Kirkpatrick et al. (2024). Vertical dashed lines delineate the mass ranges of this work, detailed in Table 2.
Current usage metrics show cumulative count of Article Views (full-text article views including HTML views, PDF and ePub downloads, according to the available data) and Abstracts Views on Vision4Press platform.
Data correspond to usage on the plateform after 2015. The current usage metrics is available 48-96 hours after online publication and is updated daily on week days.
Initial download of the metrics may take a while.