Fig. 4
Download original image
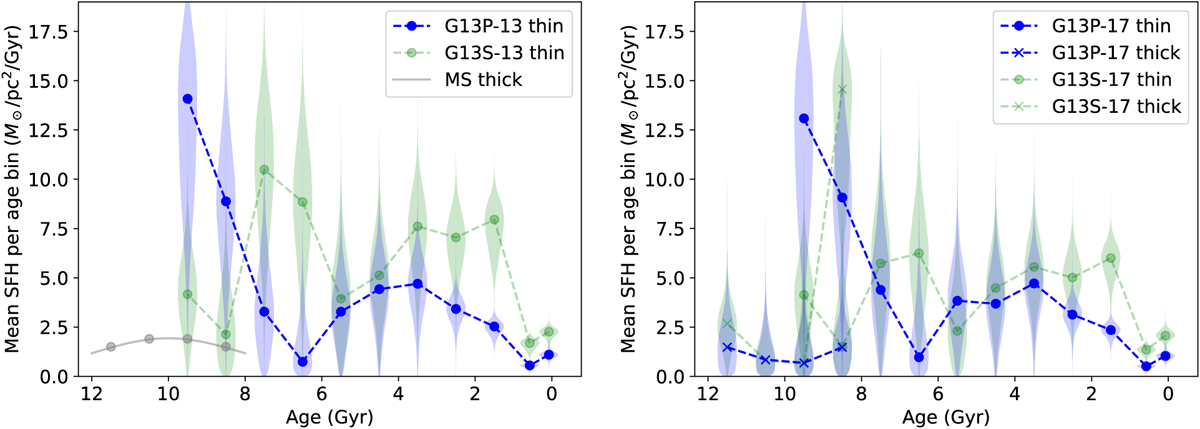
Posterior SFHs inferred with BGM FASt in the different executions. Those performed fixing the thick disc are found on the left, while the executions including the fit of the thick disc SFH are set on the right. For completeness, in the left plot, we also show in grey the fixed thick disc SFH. We distinguish in blue and green the SEM used to build the MS of each execution, PARSEC and STAREVOL, respectively. The marginalised posterior distributions for each of the weights of each age bin are represented as vertical shaded areas (the so-called violin plot).
Current usage metrics show cumulative count of Article Views (full-text article views including HTML views, PDF and ePub downloads, according to the available data) and Abstracts Views on Vision4Press platform.
Data correspond to usage on the plateform after 2015. The current usage metrics is available 48-96 hours after online publication and is updated daily on week days.
Initial download of the metrics may take a while.