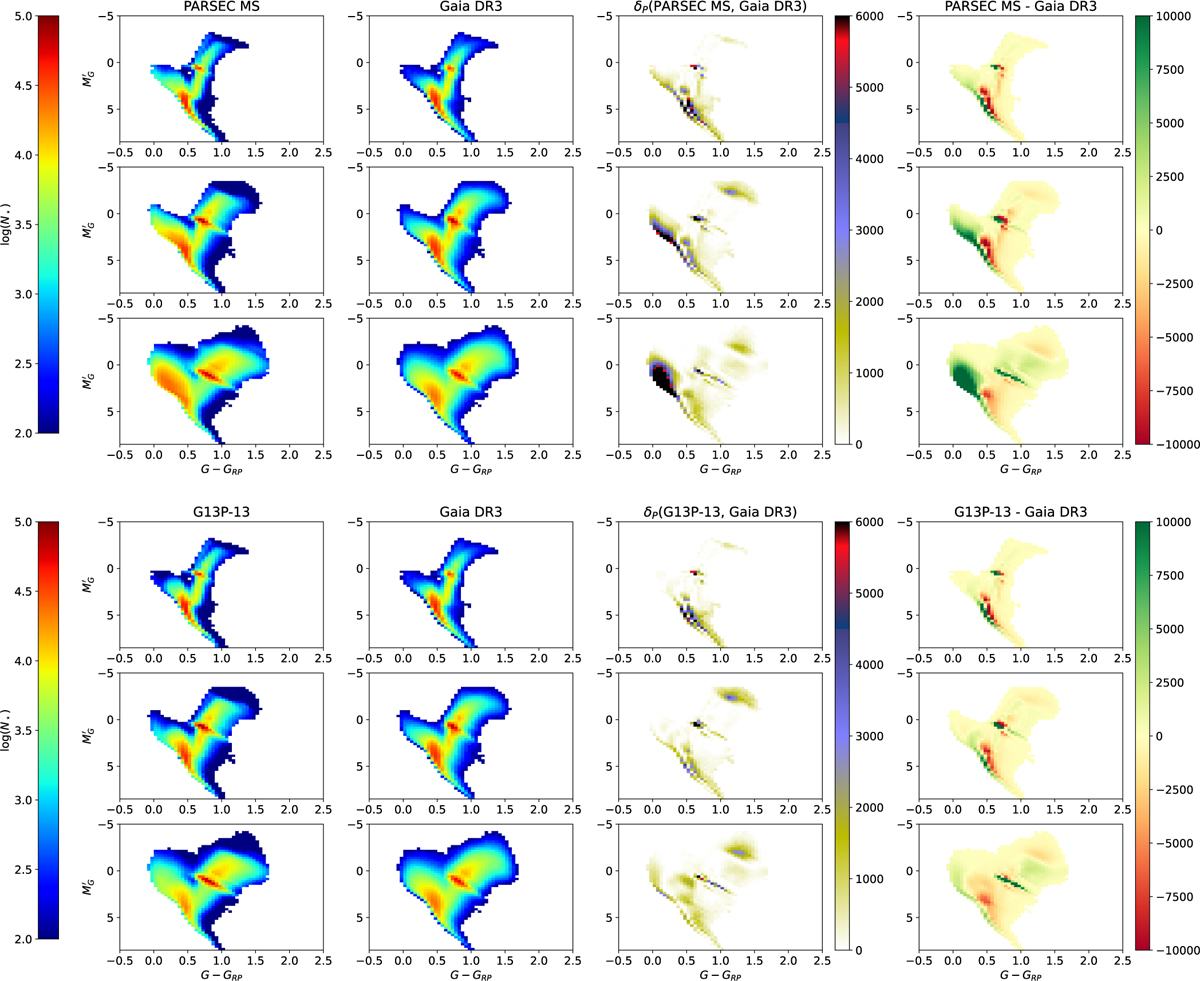
Fig. D.1
Download original image
Top: from left to right-hand side, columns show CMDs of the PARSEC MS used in execution G13P-13, Gaia DR3 G < 13 data, distance per pixel between them (each of the elements of the summation in Eq. (4)), and their absolute difference in number of stars. From the top to the bottom rows, we find the CMDs for the three considered latitude ranges 30 < |b| < 90, 10 < |b| < 30, 0 < |b| < 10. Bottom: same as on top but for the final BGM FASt PS obtained from the application of the fitting process described in Sect. 2.1 on PARSEC MS.
Current usage metrics show cumulative count of Article Views (full-text article views including HTML views, PDF and ePub downloads, according to the available data) and Abstracts Views on Vision4Press platform.
Data correspond to usage on the plateform after 2015. The current usage metrics is available 48-96 hours after online publication and is updated daily on week days.
Initial download of the metrics may take a while.