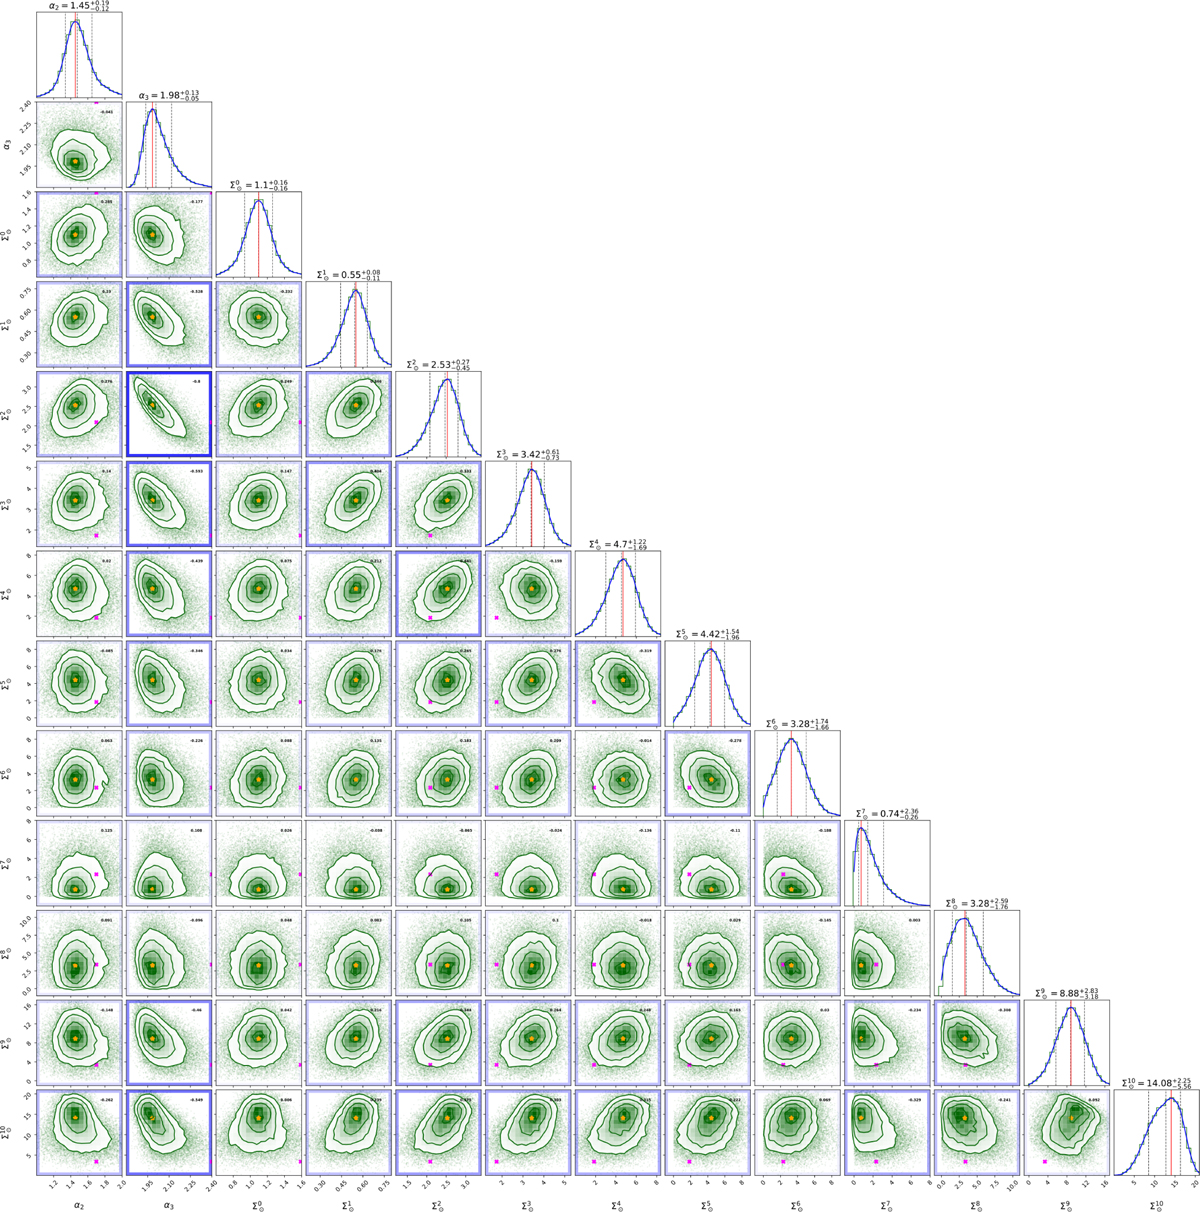
Fig. C.1
Download original image
Corner plot containing the parameters derived from our fiducial execution G13P-13, including two slopes of the IMF and 11 parameters for the SFH of the thin disc. At the top of the columns, the projected approximate posterior PDF of each parameter with its Gaussian fit is shown, as well as the resulting most probable value and 16th and 84th percentiles, which are also marked with solid and dashed lines, respectively. It is indicated with a dashed line the median of the distributions. In black at the top right of each plot we show Pearson’s correlation coefficient. High values of this coefficient are highlighted with an intense blue frame in the plot. Finally, the parameters adopted by the MS are marked with a magenta cross and the final values with an orange star.
Current usage metrics show cumulative count of Article Views (full-text article views including HTML views, PDF and ePub downloads, according to the available data) and Abstracts Views on Vision4Press platform.
Data correspond to usage on the plateform after 2015. The current usage metrics is available 48-96 hours after online publication and is updated daily on week days.
Initial download of the metrics may take a while.