Fig. 4
Download original image
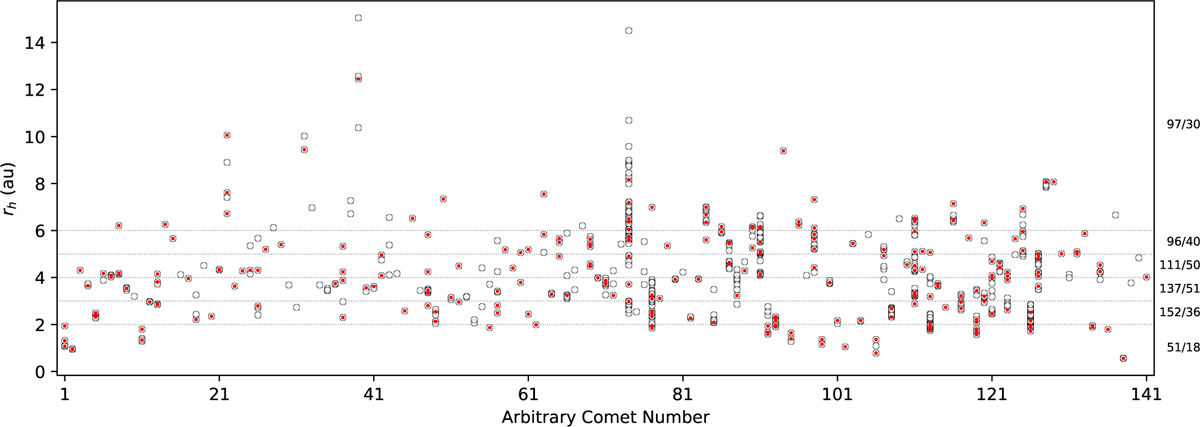
Distribution of strands into comets and over heliocentric distance. Pre-perihelion strand midpoints (vertical axis) are plotted as open circles for each comet (horizontal axis) in the original sample (644 strands for 141 comets). Horizontal dotted lines mark heliocentric bin boundaries. Numbers of strands and comets in each bin in the original sample are shown separated by a slash to the right of the Figure. A debiased strand sample (see text for details) is overplotted as red dots.
Current usage metrics show cumulative count of Article Views (full-text article views including HTML views, PDF and ePub downloads, according to the available data) and Abstracts Views on Vision4Press platform.
Data correspond to usage on the plateform after 2015. The current usage metrics is available 48-96 hours after online publication and is updated daily on week days.
Initial download of the metrics may take a while.