Fig. 11
Download original image
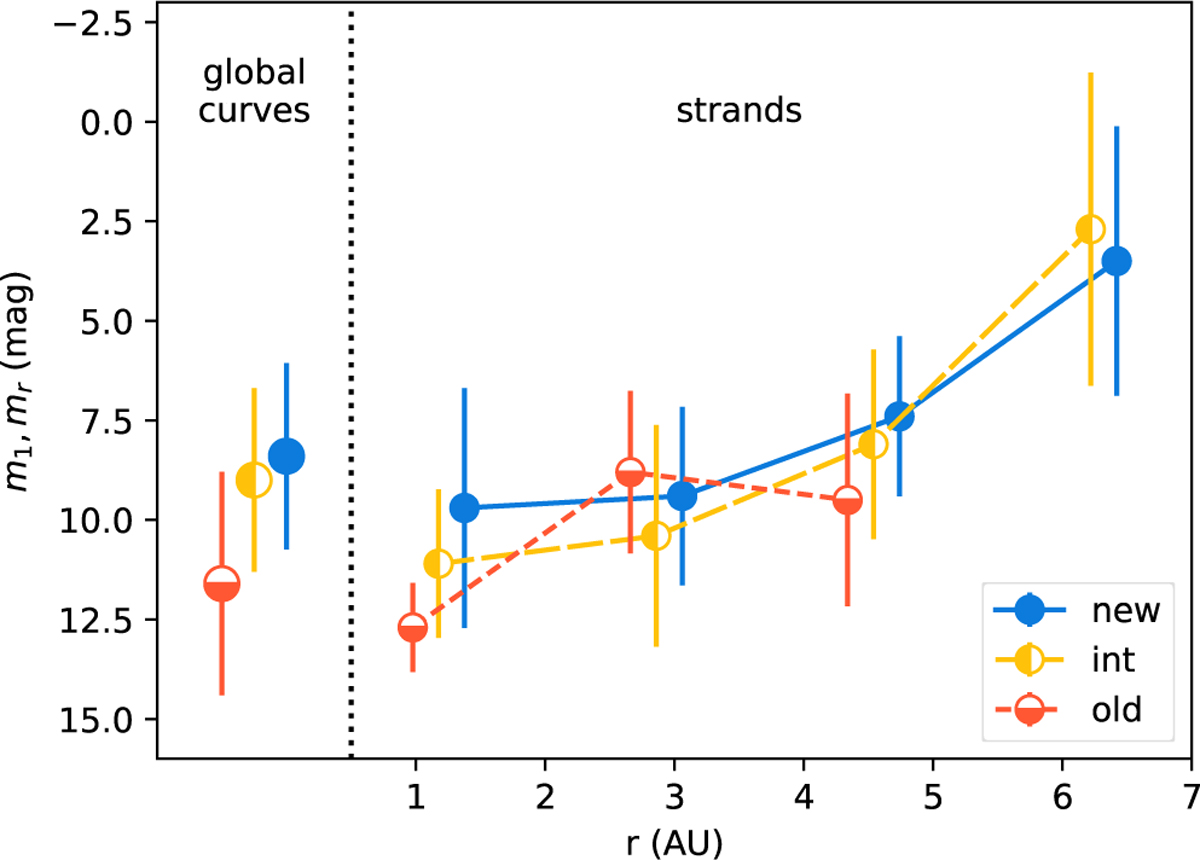
Median mr for strands as a function of heliocentric distance and Oort group (shown to the right of the vertical dashed line). Strands are binned in equal-sized rmin bins (linear r), and the median mr and median absolute deviation are plotted as points and error bars, respectively. Bin centers coincide with the x-axis location of the “int.” symbols and the “new” and “old” symbols where horizontally nudged for clarity. To the left of the vertical dashed line are the m1 distribution median plus or minus the mean absolute deviation for global curves.
Current usage metrics show cumulative count of Article Views (full-text article views including HTML views, PDF and ePub downloads, according to the available data) and Abstracts Views on Vision4Press platform.
Data correspond to usage on the plateform after 2015. The current usage metrics is available 48-96 hours after online publication and is updated daily on week days.
Initial download of the metrics may take a while.