Fig. 6.
Download original image
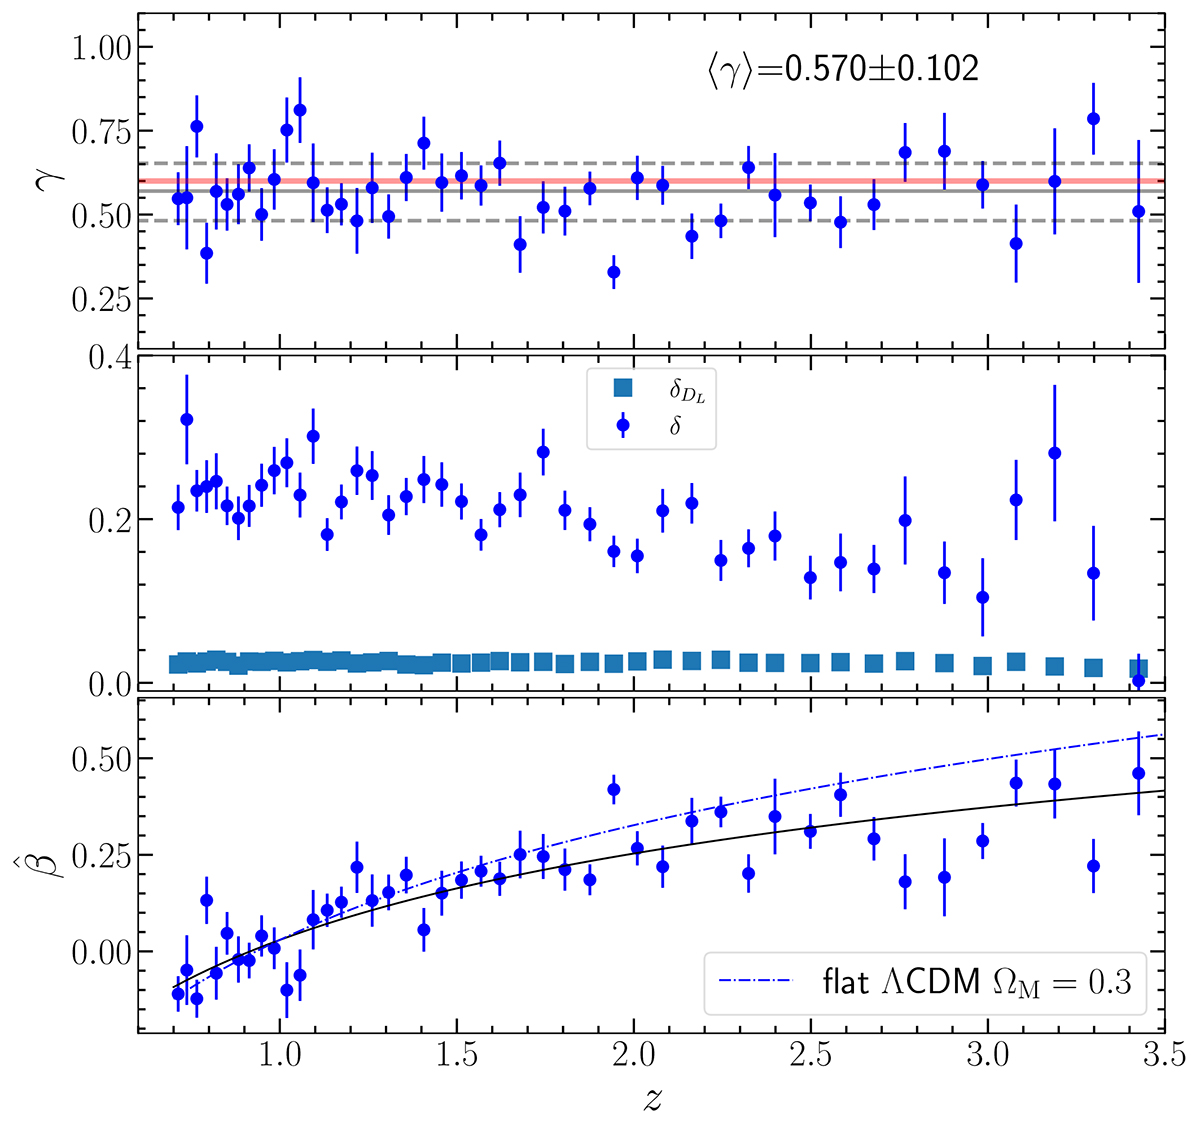
Same as for Figure 5 but with a much finer binning within the redshift range 0.7–3.5. The bottom panel presents ![]() from Equation 3 as a function of redshift. The solid black line is a second-order cosmographic fit of the data, for which a Gaussian prior is considered on both γ and β (i.e. γ = 0.600 ± 0.005 and β = 8.00 ± 0.25). The dash-dotted line is a flat ΛCDM model with ΩM fixed to 0.3, γ and β fixed to 0.6 and 8.0, and normalised to the cosmographic fit at z = 1.
from Equation 3 as a function of redshift. The solid black line is a second-order cosmographic fit of the data, for which a Gaussian prior is considered on both γ and β (i.e. γ = 0.600 ± 0.005 and β = 8.00 ± 0.25). The dash-dotted line is a flat ΛCDM model with ΩM fixed to 0.3, γ and β fixed to 0.6 and 8.0, and normalised to the cosmographic fit at z = 1.
Current usage metrics show cumulative count of Article Views (full-text article views including HTML views, PDF and ePub downloads, according to the available data) and Abstracts Views on Vision4Press platform.
Data correspond to usage on the plateform after 2015. The current usage metrics is available 48-96 hours after online publication and is updated daily on week days.
Initial download of the metrics may take a while.