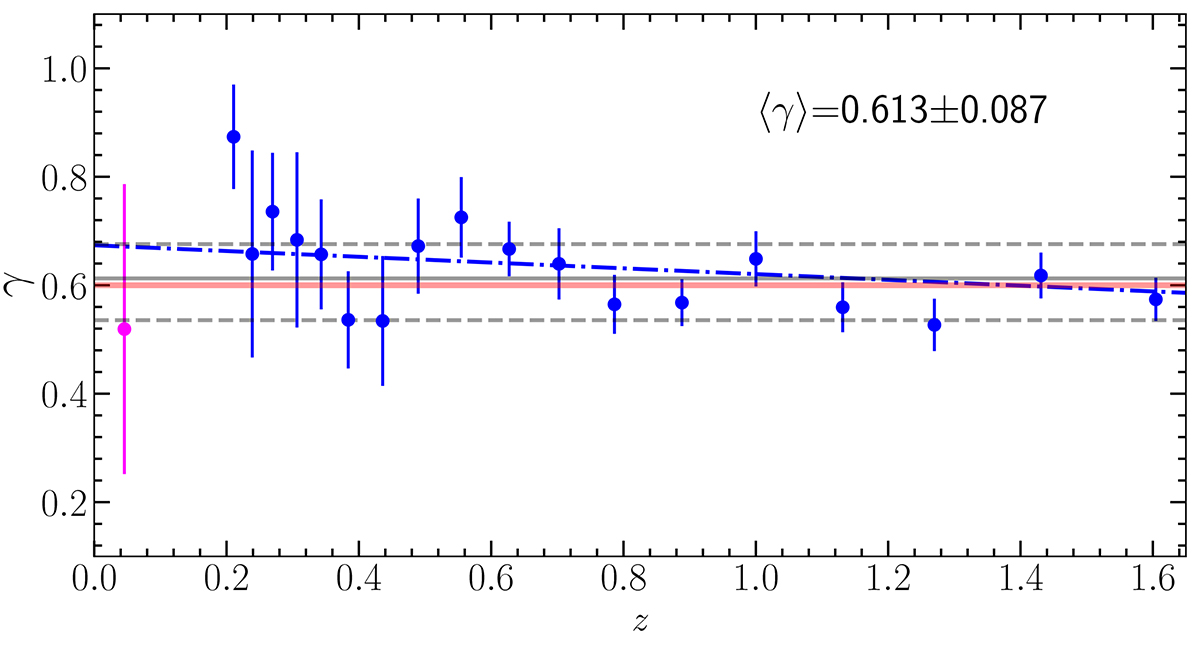
Fig. 2.
Download original image
Best-fit slope and intrinsic dispersion from the regression analysis of the FX − FUV relation in narrow redshift intervals from z = 0.2 to z = 1.6. A linear fit of γ as a function of redshift in the form γ = m z + q gives m = −0.052 ± 0.018 and q = 0.673 ± 0.026 (dash-dotted blue line). Host-galaxy contamination at z < 0.7 mimics a spurious redshift evolution of γ. For a comparison, we overplot the resulting fit (magenta point) of the 13 local AGN in the redshift range 0.009 < z < 0.087, whose flux at 2500 Å is directly evaluated from their UV spectra.
Current usage metrics show cumulative count of Article Views (full-text article views including HTML views, PDF and ePub downloads, according to the available data) and Abstracts Views on Vision4Press platform.
Data correspond to usage on the plateform after 2015. The current usage metrics is available 48-96 hours after online publication and is updated daily on week days.
Initial download of the metrics may take a while.