Fig. 5
Download original image
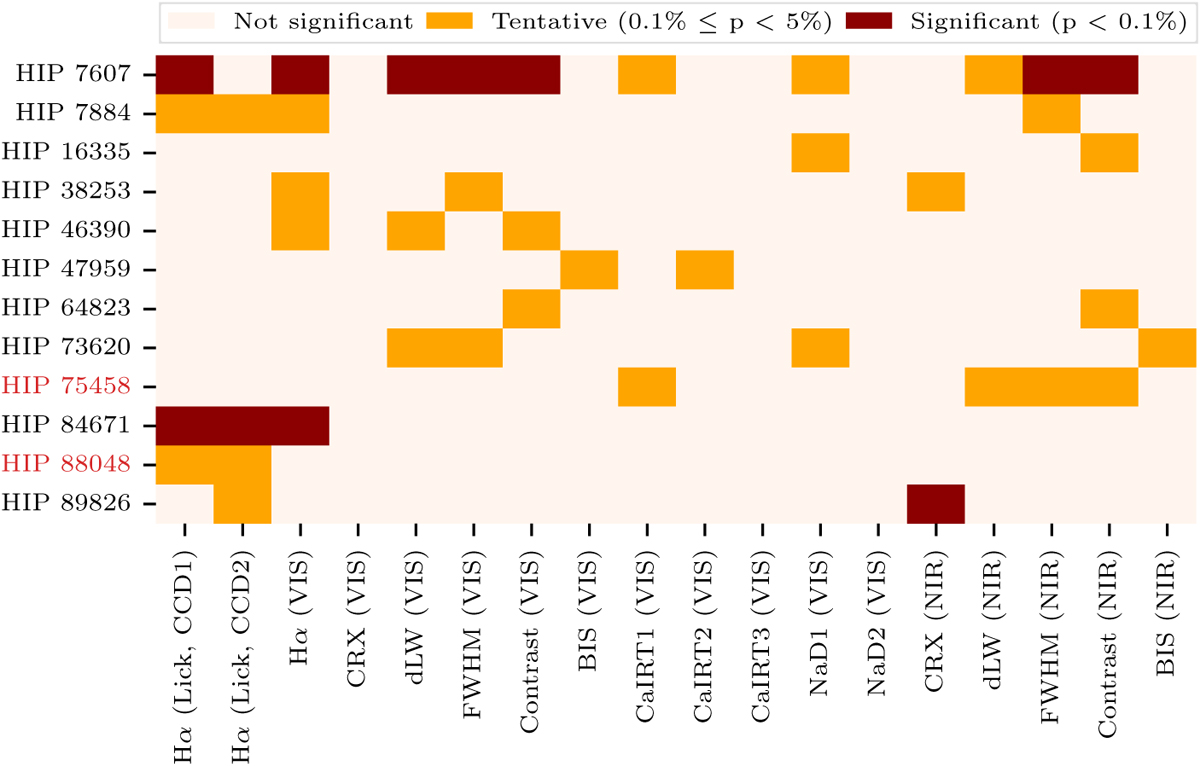
Results of the linear correlation analysis. For each star we show the significance of the linear correlation between the activity indicator labeled on the x-axis and the respective RV data set. Red colors indicate significant (p < 0.1%) linear correlations, while orange colors represent tentative (0.1% ≤ p < 5%) correlations. The identifiers of the two planet hosts, HIP 75458 and HIP 88048, are marked in red.
Current usage metrics show cumulative count of Article Views (full-text article views including HTML views, PDF and ePub downloads, according to the available data) and Abstracts Views on Vision4Press platform.
Data correspond to usage on the plateform after 2015. The current usage metrics is available 48-96 hours after online publication and is updated daily on week days.
Initial download of the metrics may take a while.