Fig. 3
Download original image
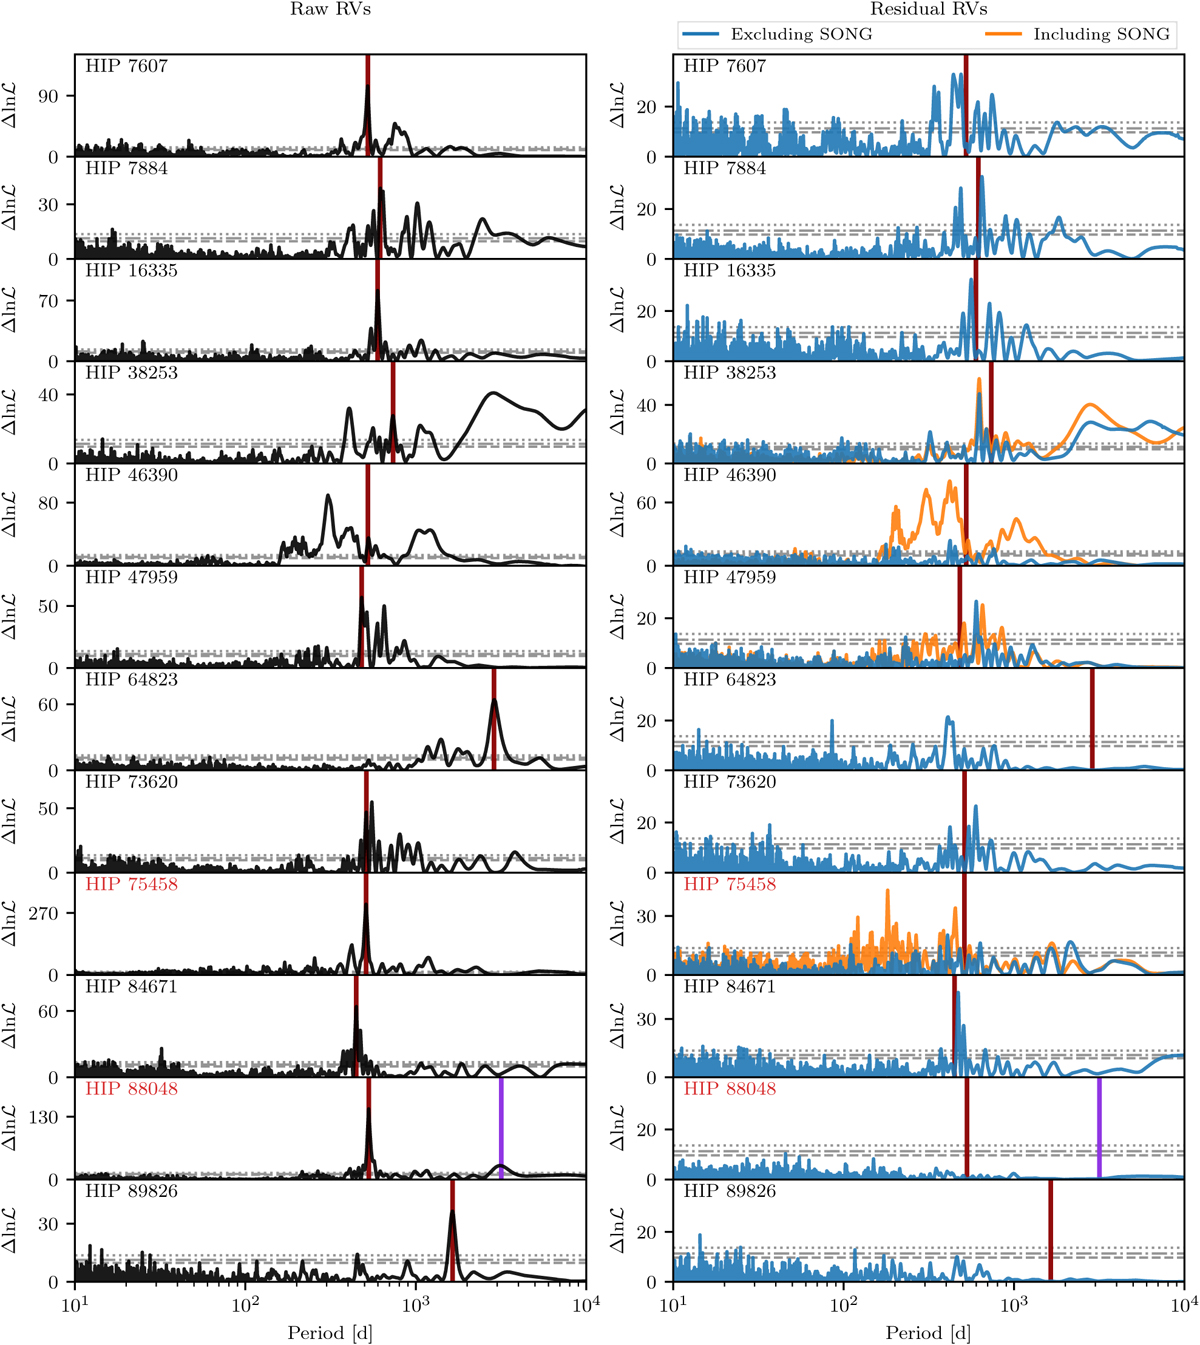
Maximum likelihood periodograms of the RVs (left) and the residuals (right) after subtracting the best Keplerian model. As the SONG RVs are known to show spurious RV periodicity at a one-year period (Heeren et al. 2023), we plot the MLPs of the residual RVs excluding the SONG data in blue, while the periodograms including the SONG data are shown in orange. The FAPs of 5% (dashed), 1% (dash-dotted), and 0.1% (dotted) are plotted as gray horizontal lines. The identifiers of the two planet hosts, HIP 75458 and HIP 88048, are marked in red. Significant periodicity remains close to the strongest RV period after removing the best fit for many of the stars.
Current usage metrics show cumulative count of Article Views (full-text article views including HTML views, PDF and ePub downloads, according to the available data) and Abstracts Views on Vision4Press platform.
Data correspond to usage on the plateform after 2015. The current usage metrics is available 48-96 hours after online publication and is updated daily on week days.
Initial download of the metrics may take a while.