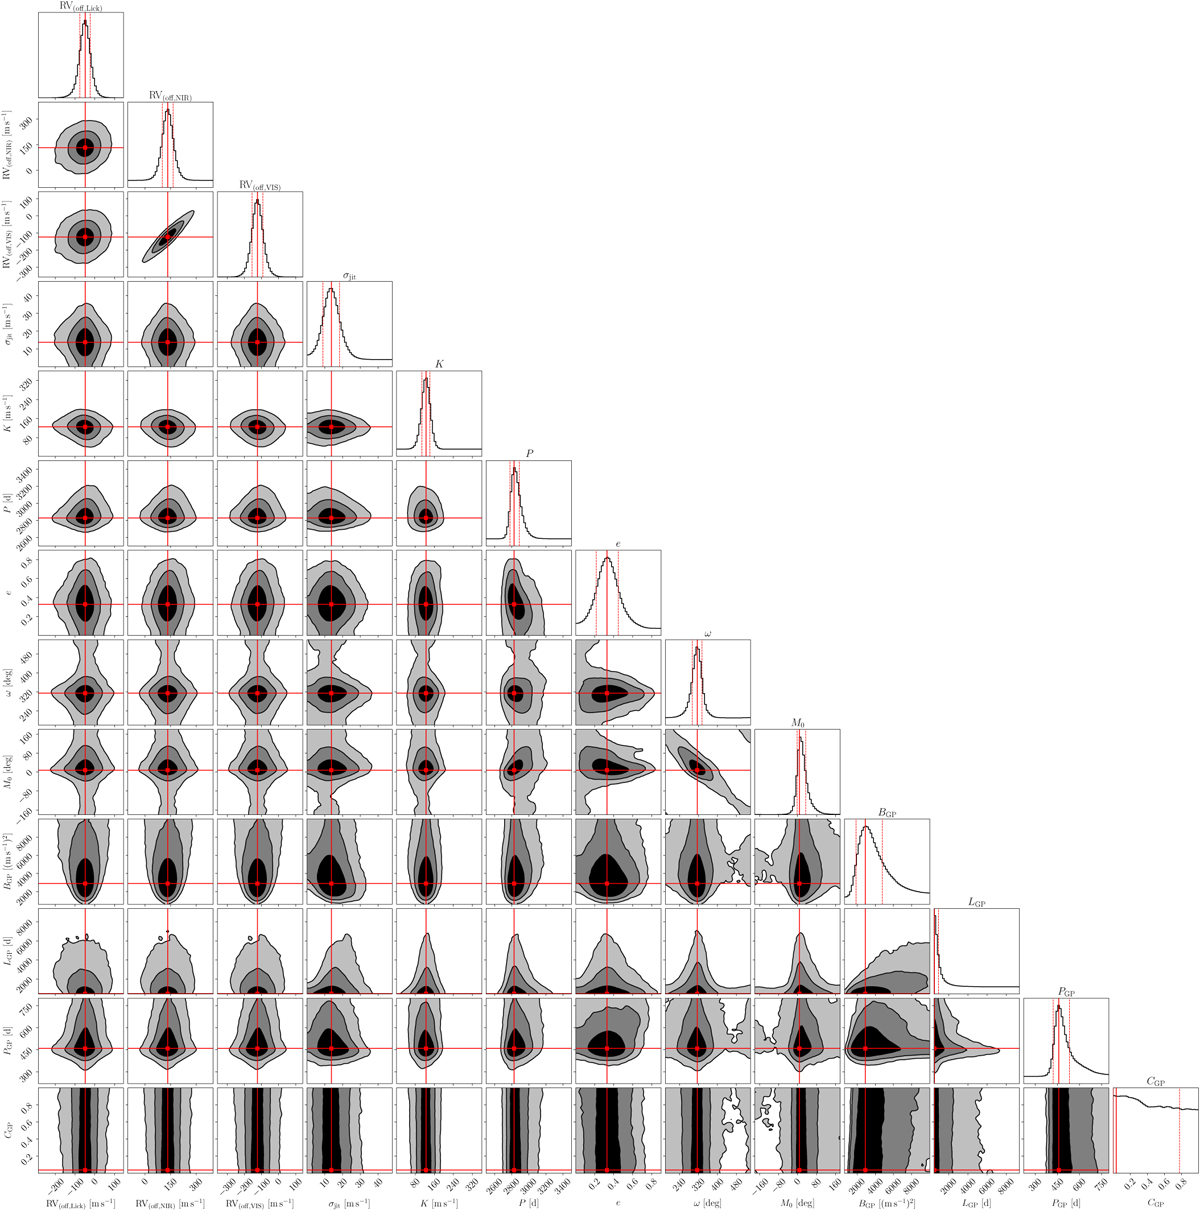
Fig. D.1
Download original image
Corner plot of the posterior samples of the joint 1P+GP model for HIP 64283. The mode of each parameter, marked as the continuous, red line, was adopted as the best fitting parameter in Table 4. The red dashed lines mark the interval that contains 68% of the posterior samples. We note that the posteriors of the planet model are well constrained, while the posteriors of the GP model (especially the factor C) are relatively broad and thus allow for a wide range of models.
Current usage metrics show cumulative count of Article Views (full-text article views including HTML views, PDF and ePub downloads, according to the available data) and Abstracts Views on Vision4Press platform.
Data correspond to usage on the plateform after 2015. The current usage metrics is available 48-96 hours after online publication and is updated daily on week days.
Initial download of the metrics may take a while.