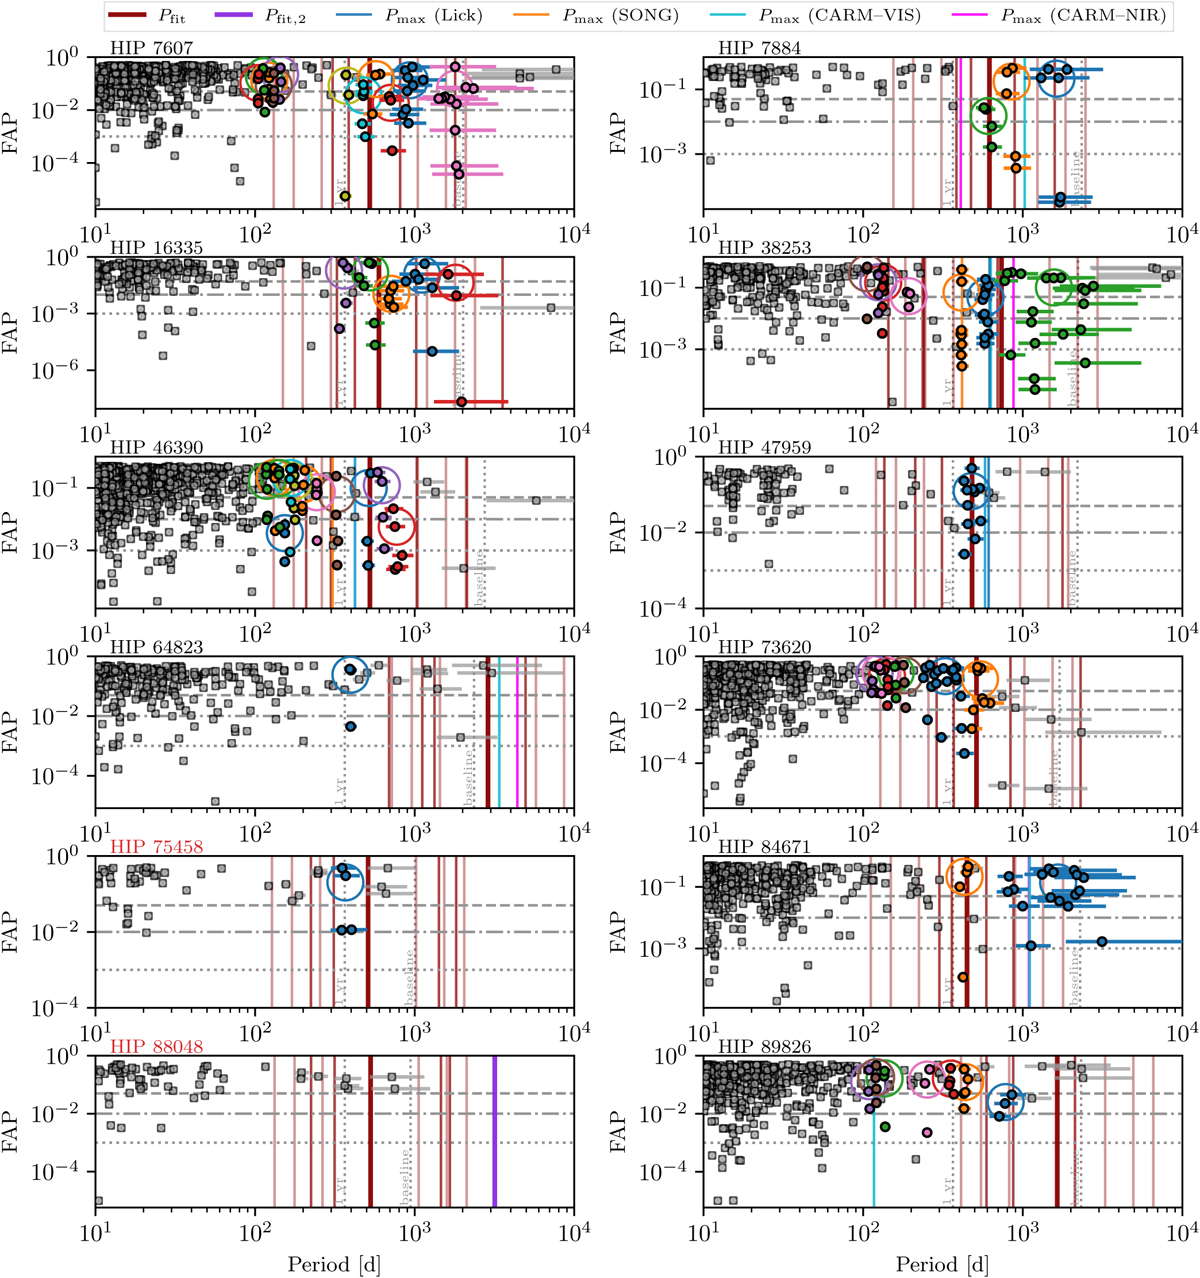
Fig. B.1
Download original image
Results of the DBSCAN clustering algorithm. In each panel, all identified peaks in the MLPs of the CARMENES activity indicators are shown as filled circles. Arbitrarily colored circles represent activity peaks assigned to clusters by DBSCAN, while gray circles indicate peaks that are not part of any cluster. The larger, empty circles indicate the center periods and FAPs of the clusters. We further overplot the FAP levels of 5% (dashed), 1% (dash-dotted), and 0.1% (dotted) as horizontal gray lines, and the fitted RV period (thick), its aliases (thin, based on the VIS window function), and harmonics (lower opacity) as vertical red lines. Furthermore, for stars where individual instruments exhibit a strongest period that deviates from the fitted period by at least 10% (restricted to 100 d < Pmax < 5000 d), we overplot the strongest RV period detected in the MLP of the respective instrument using vertical, colored lines specified in the figure legend. The identifiers of the two planet hosts, HIP 75458 and HIP 88048, are marked in red. For the latter, we also mark the periodicity of the outer orbital companion in violet.
Current usage metrics show cumulative count of Article Views (full-text article views including HTML views, PDF and ePub downloads, according to the available data) and Abstracts Views on Vision4Press platform.
Data correspond to usage on the plateform after 2015. The current usage metrics is available 48-96 hours after online publication and is updated daily on week days.
Initial download of the metrics may take a while.