Fig. A.1
Download original image
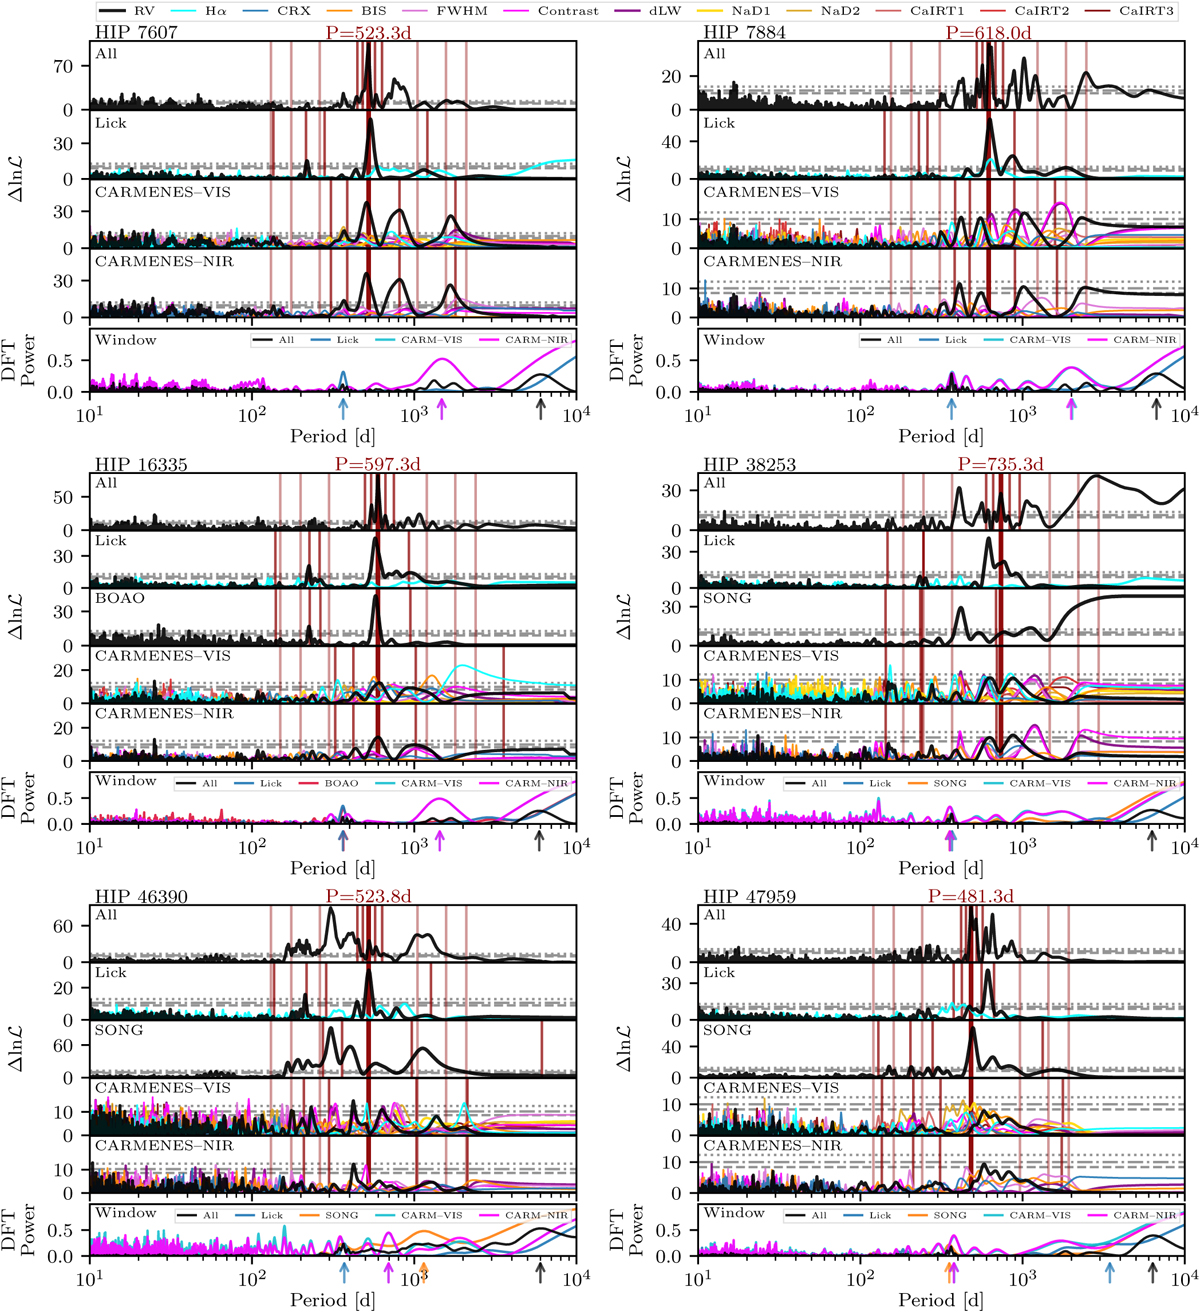
Maximum likelihood periodograms for six sample stars. The top panel for each star portrays the combined RV MLP. In the remaining panels, we show the MLPs of the RVs (black) and activity indicators (see legend) for each instrument. The FAPs of 5% (dashed), 1% (dash-dotted), and 0.1% (dotted) are plotted as gray horizontal lines. The bottom panel shows the instruments’ window functions derived as discrete Fourier transforms. The thick, red, vertical line indicates the period of the Keplerian fit (see Table 3). The alias periods, corresponding to the most significant peak in the respective window function, are shown as thinner lines. The positions of these window peaks are marked with colored arrows in the bottom panels. Notably, the CARMENES VIS and NIR window functions largely overlap. Additionally, we display the harmonics and sub-harmonics of the period of the Keplerian fit as red lines with lower opacity.
Current usage metrics show cumulative count of Article Views (full-text article views including HTML views, PDF and ePub downloads, according to the available data) and Abstracts Views on Vision4Press platform.
Data correspond to usage on the plateform after 2015. The current usage metrics is available 48-96 hours after online publication and is updated daily on week days.
Initial download of the metrics may take a while.