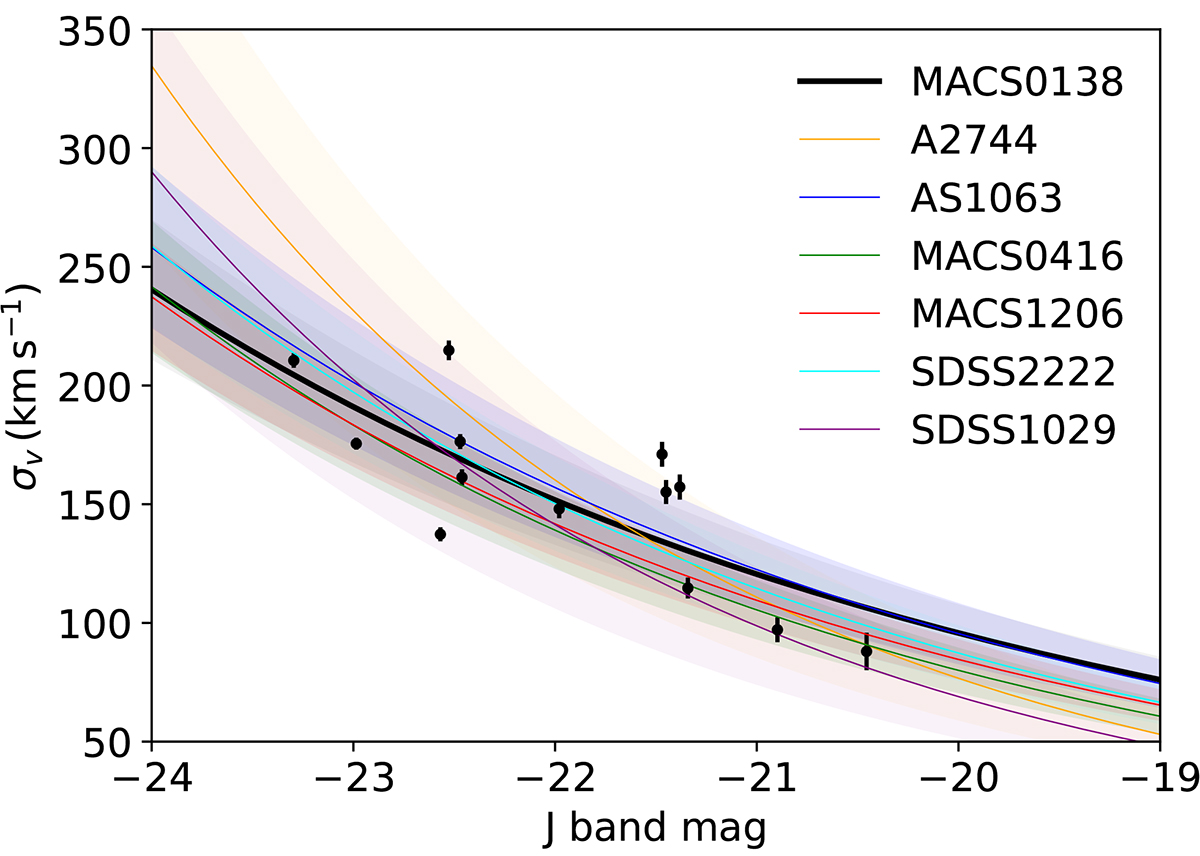
Fig. 7.
Download original image
Faber-Jackson relation for the members of MACS0138 compared with those for six SL clusters at 0.31 ≤ z ≤ 0.59. We show the best-fit relation and its scatter for MACS0138 (in black), A2744 (in orange), AS1063 (in blue), MACS0416 (in green), MACS1206 (in red), SDSS2222 (in cyan), and SDSS1029 (in purple). The black dots are the 13 cluster members selected in Sect. 4.2.
Current usage metrics show cumulative count of Article Views (full-text article views including HTML views, PDF and ePub downloads, according to the available data) and Abstracts Views on Vision4Press platform.
Data correspond to usage on the plateform after 2015. The current usage metrics is available 48-96 hours after online publication and is updated daily on week days.
Initial download of the metrics may take a while.