Open Access
Fig. 2.
Download original image
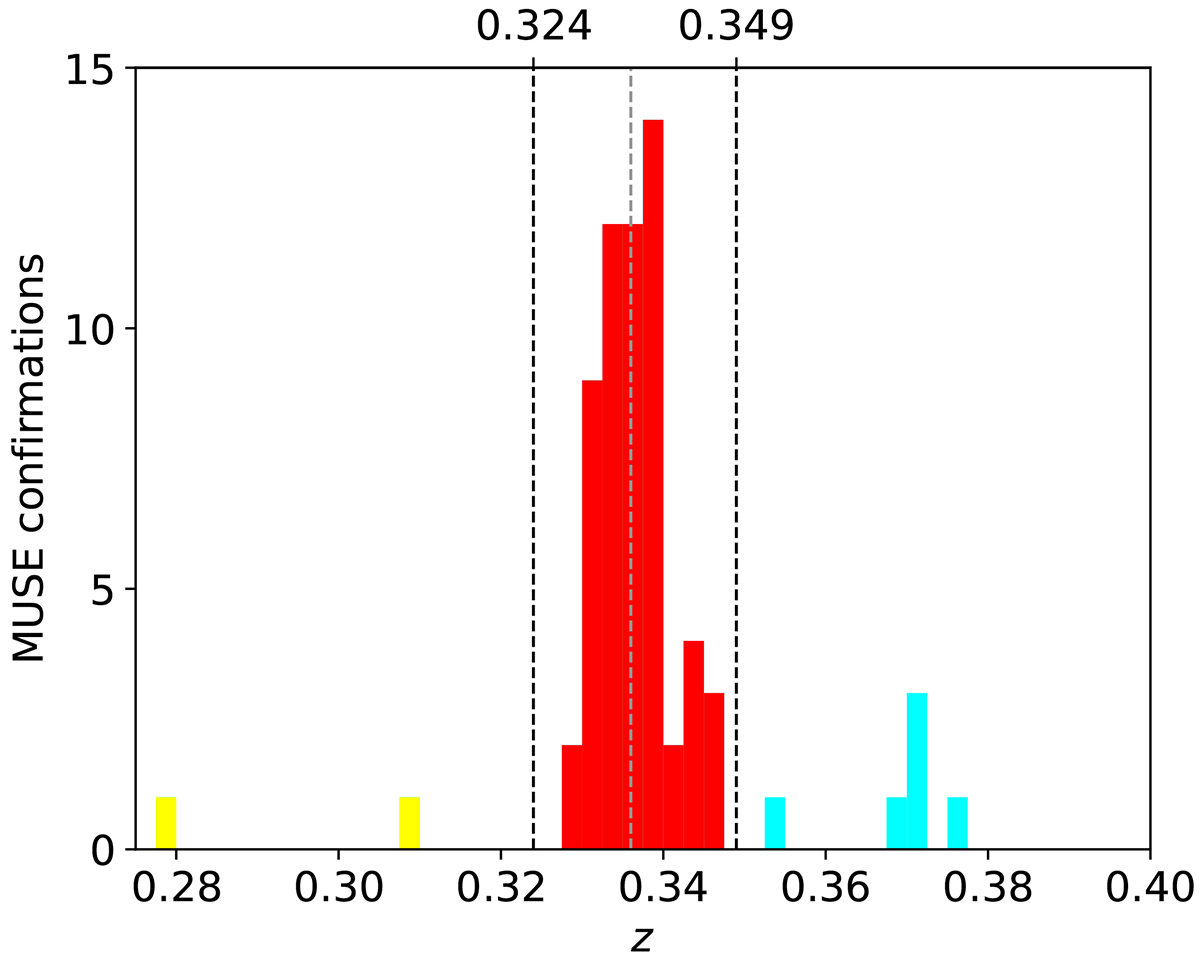
Redshift distribution around the cluster redshift (zcluster = 0.336, marked with a dashed grey line). Cluster members are indicated in red, and foreground and background objects in yellow and cyan, respectively. The vertical lines indicate the region with a relative velocity of ± 2500 km s−1 from the cluster mean redshift.
Current usage metrics show cumulative count of Article Views (full-text article views including HTML views, PDF and ePub downloads, according to the available data) and Abstracts Views on Vision4Press platform.
Data correspond to usage on the plateform after 2015. The current usage metrics is available 48-96 hours after online publication and is updated daily on week days.
Initial download of the metrics may take a while.