Fig. 1.
Download original image
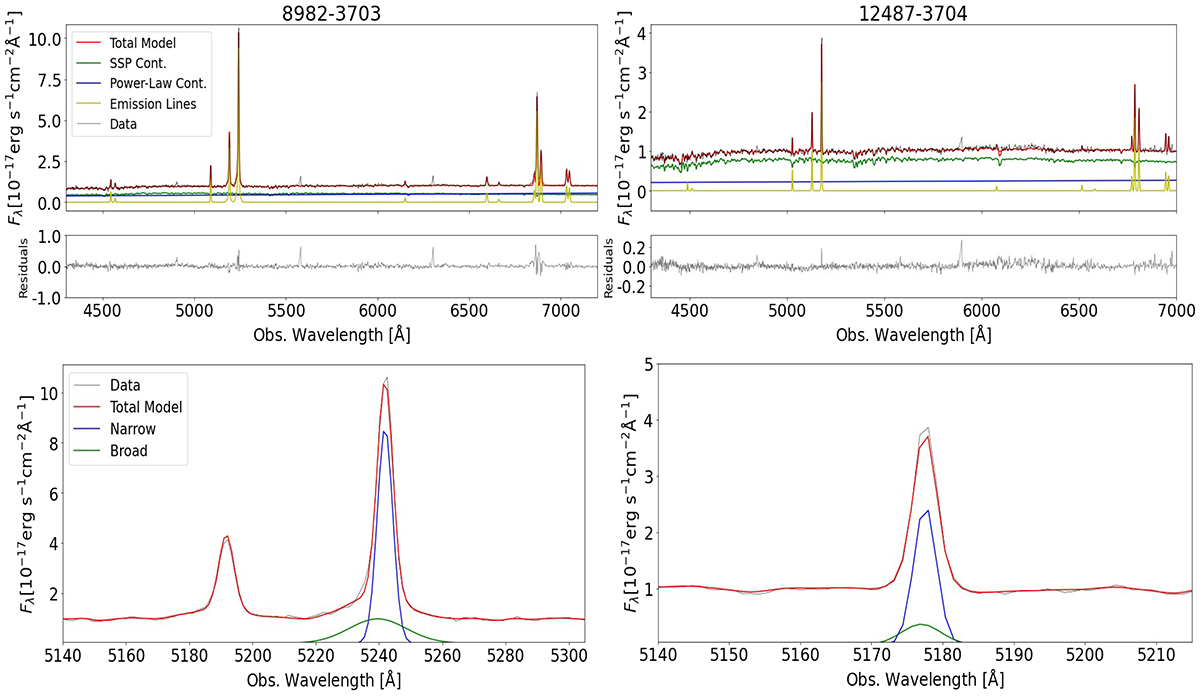
Top left and right: Spectra of the galaxies 8982−3703 and 12487−3704, respectively. The dark line is the stacked spectrum of the AGN spaxels. The green line is the best fit of the stellar continuum combining SSPs. The blue line is an additional power-law component, the yellow line represents the fitted emission lines, and the red line is the sum of all these components that compose the total model. The residuals after subtraction of the total model from the data are shown at the bottom. Bottom-left and right: Zoom-in on the [OIII]λ5007 Å doublet region of the stacked spectrum. The [OIII] line is fitted by a narrow (blue) and a broad (green) component.
Current usage metrics show cumulative count of Article Views (full-text article views including HTML views, PDF and ePub downloads, according to the available data) and Abstracts Views on Vision4Press platform.
Data correspond to usage on the plateform after 2015. The current usage metrics is available 48-96 hours after online publication and is updated daily on week days.
Initial download of the metrics may take a while.