Fig. 8
Download original image
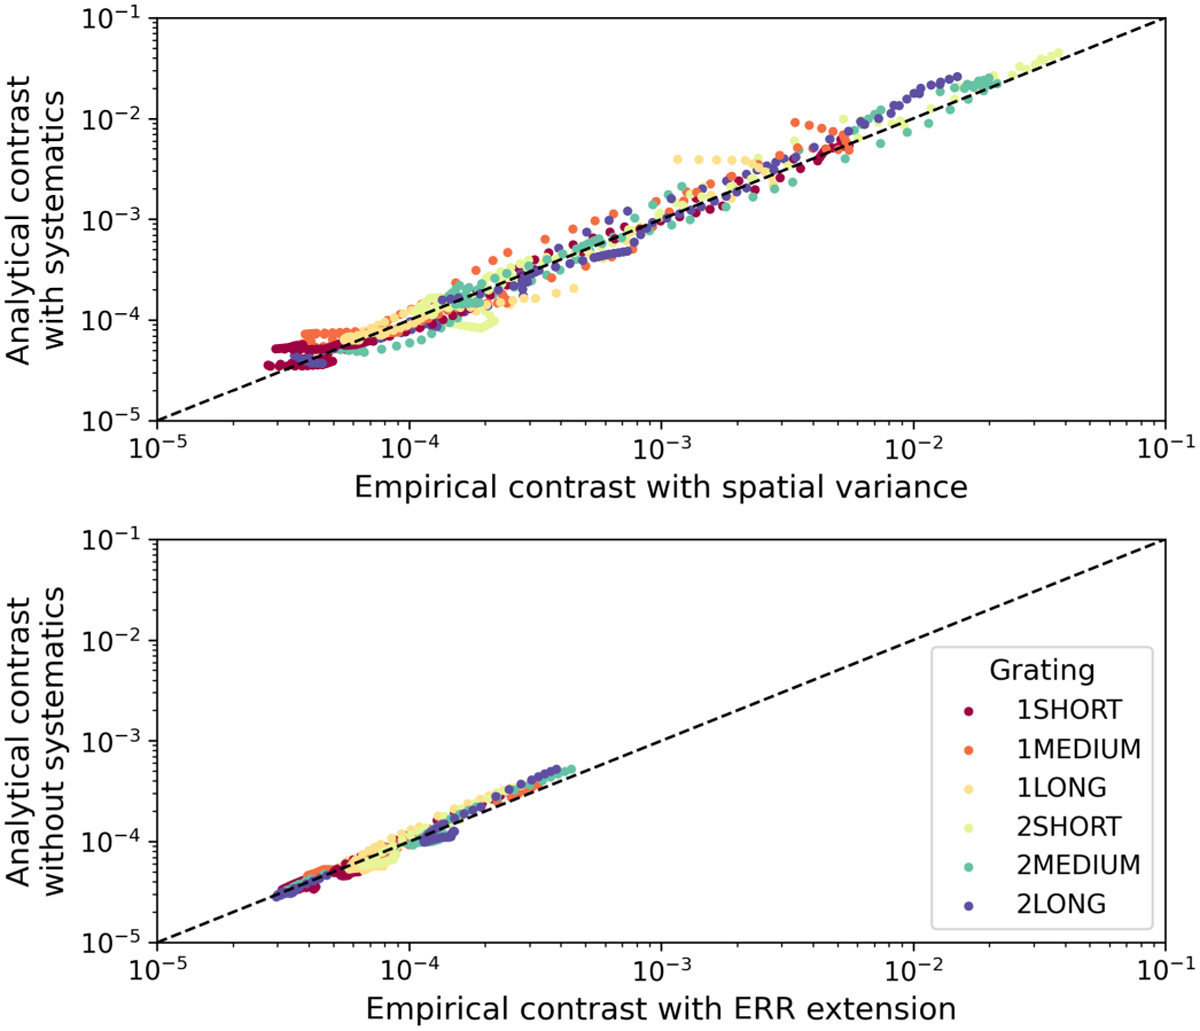
Comparison of analytical noise levels (y axis) with systematics ![]() (top) and without systematics
(top) and without systematics ![]() (bottom), against empirical noise levels in simulated data (x-axis) from spatial standard deviations
(bottom), against empirical noise levels in simulated data (x-axis) from spatial standard deviations ![]() (top) and ERR extensions
(top) and ERR extensions ![]() (bottom). Each point is a given separation, for a given band and data set. The simulated data considered are those used in Mâlin et al. (2023) for HR8799 (with K* = 5.24 and texp = 171 min per band) and β Pictoris (with K* = 3.48 and texp = 93 min per band).
(bottom). Each point is a given separation, for a given band and data set. The simulated data considered are those used in Mâlin et al. (2023) for HR8799 (with K* = 5.24 and texp = 171 min per band) and β Pictoris (with K* = 3.48 and texp = 93 min per band).
Current usage metrics show cumulative count of Article Views (full-text article views including HTML views, PDF and ePub downloads, according to the available data) and Abstracts Views on Vision4Press platform.
Data correspond to usage on the plateform after 2015. The current usage metrics is available 48-96 hours after online publication and is updated daily on week days.
Initial download of the metrics may take a while.