Fig. 6
Download original image
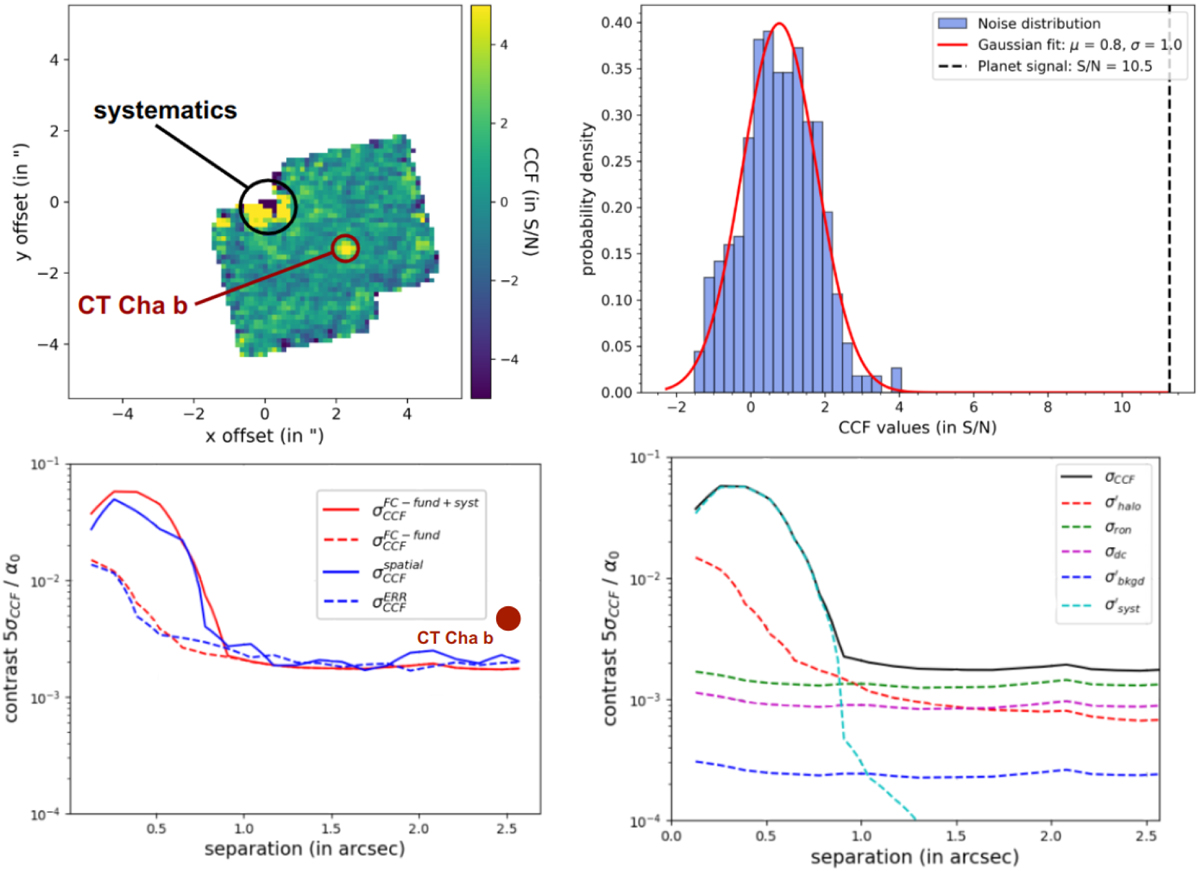
Top left: CCF of CT Cha b on-sky data on 1SHORT, calculated with a BT-Settl template at 2600 K Doppler shifted with 13.5 km/s and Rc = 100 (the S/N color scale is cropped to ±5). Top right: histogram of the CCF. Bottom left: contrast curves calculated analytically using FastCurves are shown in red, assuming texp = 56 min, K* = 8.7, and the same planetary spectrum used to compute the CCF. The solid red curve represents the result including both fundamental and systematic noise (![]() ), while the dashed red curve represents only fundamental noise
), while the dashed red curve represents only fundamental noise ![]() . Empirical contrast curves derived from on-sky data are shown in blue, where the solid blue curve corresponds to the spatial standard deviation of the CCF (
. Empirical contrast curves derived from on-sky data are shown in blue, where the solid blue curve corresponds to the spatial standard deviation of the CCF (![]() ), and the dashed blue curve corresponds to the errors estimated from the ERR extension values (
), and the dashed blue curve corresponds to the errors estimated from the ERR extension values (![]() ). Bottom right: analytical contrast contributions.
). Bottom right: analytical contrast contributions.
Current usage metrics show cumulative count of Article Views (full-text article views including HTML views, PDF and ePub downloads, according to the available data) and Abstracts Views on Vision4Press platform.
Data correspond to usage on the plateform after 2015. The current usage metrics is available 48-96 hours after online publication and is updated daily on week days.
Initial download of the metrics may take a while.