Fig. 3
Download original image
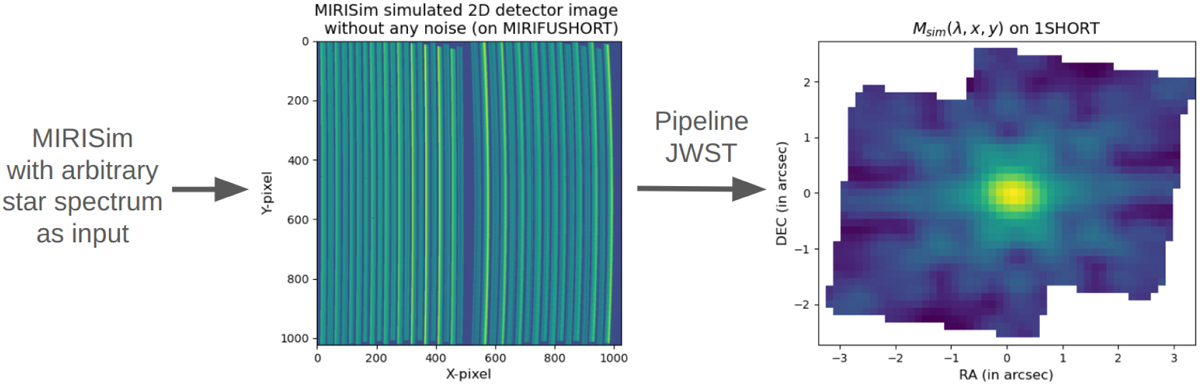
Left: noiseless MIRI/MRS 2D detector image simulated with MIRISim with an arbitrary stellar spectrum as input. The x-axis correspond to the spatial position in the FoV and y axis to the spectral dispersion. Right: cube reconstructed with the JWST pipeline from the noiseless 2D detector image simulated and divided by the input stellar spectrum.
Current usage metrics show cumulative count of Article Views (full-text article views including HTML views, PDF and ePub downloads, according to the available data) and Abstracts Views on Vision4Press platform.
Data correspond to usage on the plateform after 2015. The current usage metrics is available 48-96 hours after online publication and is updated daily on week days.
Initial download of the metrics may take a while.