Fig. D.1
Download original image
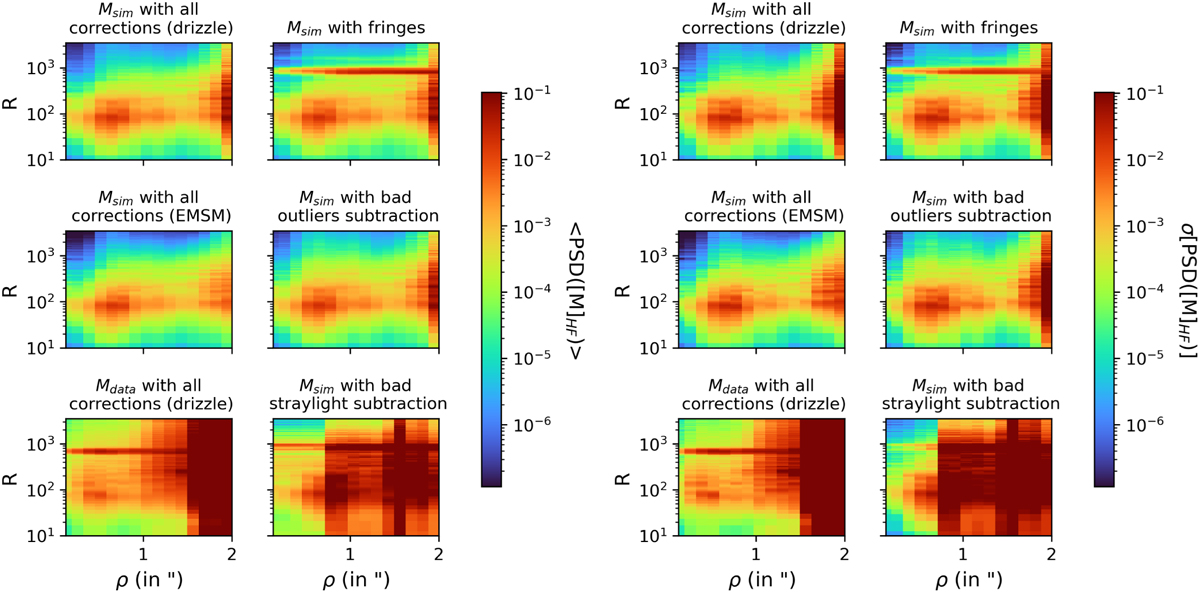
Left: Average of PSDs for each separation of the high-filtered stellar modulation functions on 1SHORT with Rc = 100. Right: Spatial variations in PSDs for each separation of the high-filtered stellar modulation functions (same as left panel but with standard deviation). The simulated stellar modulation functions Msim were estimated by injecting a BT-NextGen stellar spectrum at 6000K into MIRISim. The stellar modulation functions at each point are renormalized so as not to have the flux dependency of the PSF (which would otherwise only show a PSD concentrated at ρ ≈ 0). Mdata was estimated from HD159222 data. Edge effects, arising from both the detector and the cube reconstruction, begin to manifest at around 2 arcseconds.
Current usage metrics show cumulative count of Article Views (full-text article views including HTML views, PDF and ePub downloads, according to the available data) and Abstracts Views on Vision4Press platform.
Data correspond to usage on the plateform after 2015. The current usage metrics is available 48-96 hours after online publication and is updated daily on week days.
Initial download of the metrics may take a while.