Fig. 21
Download original image
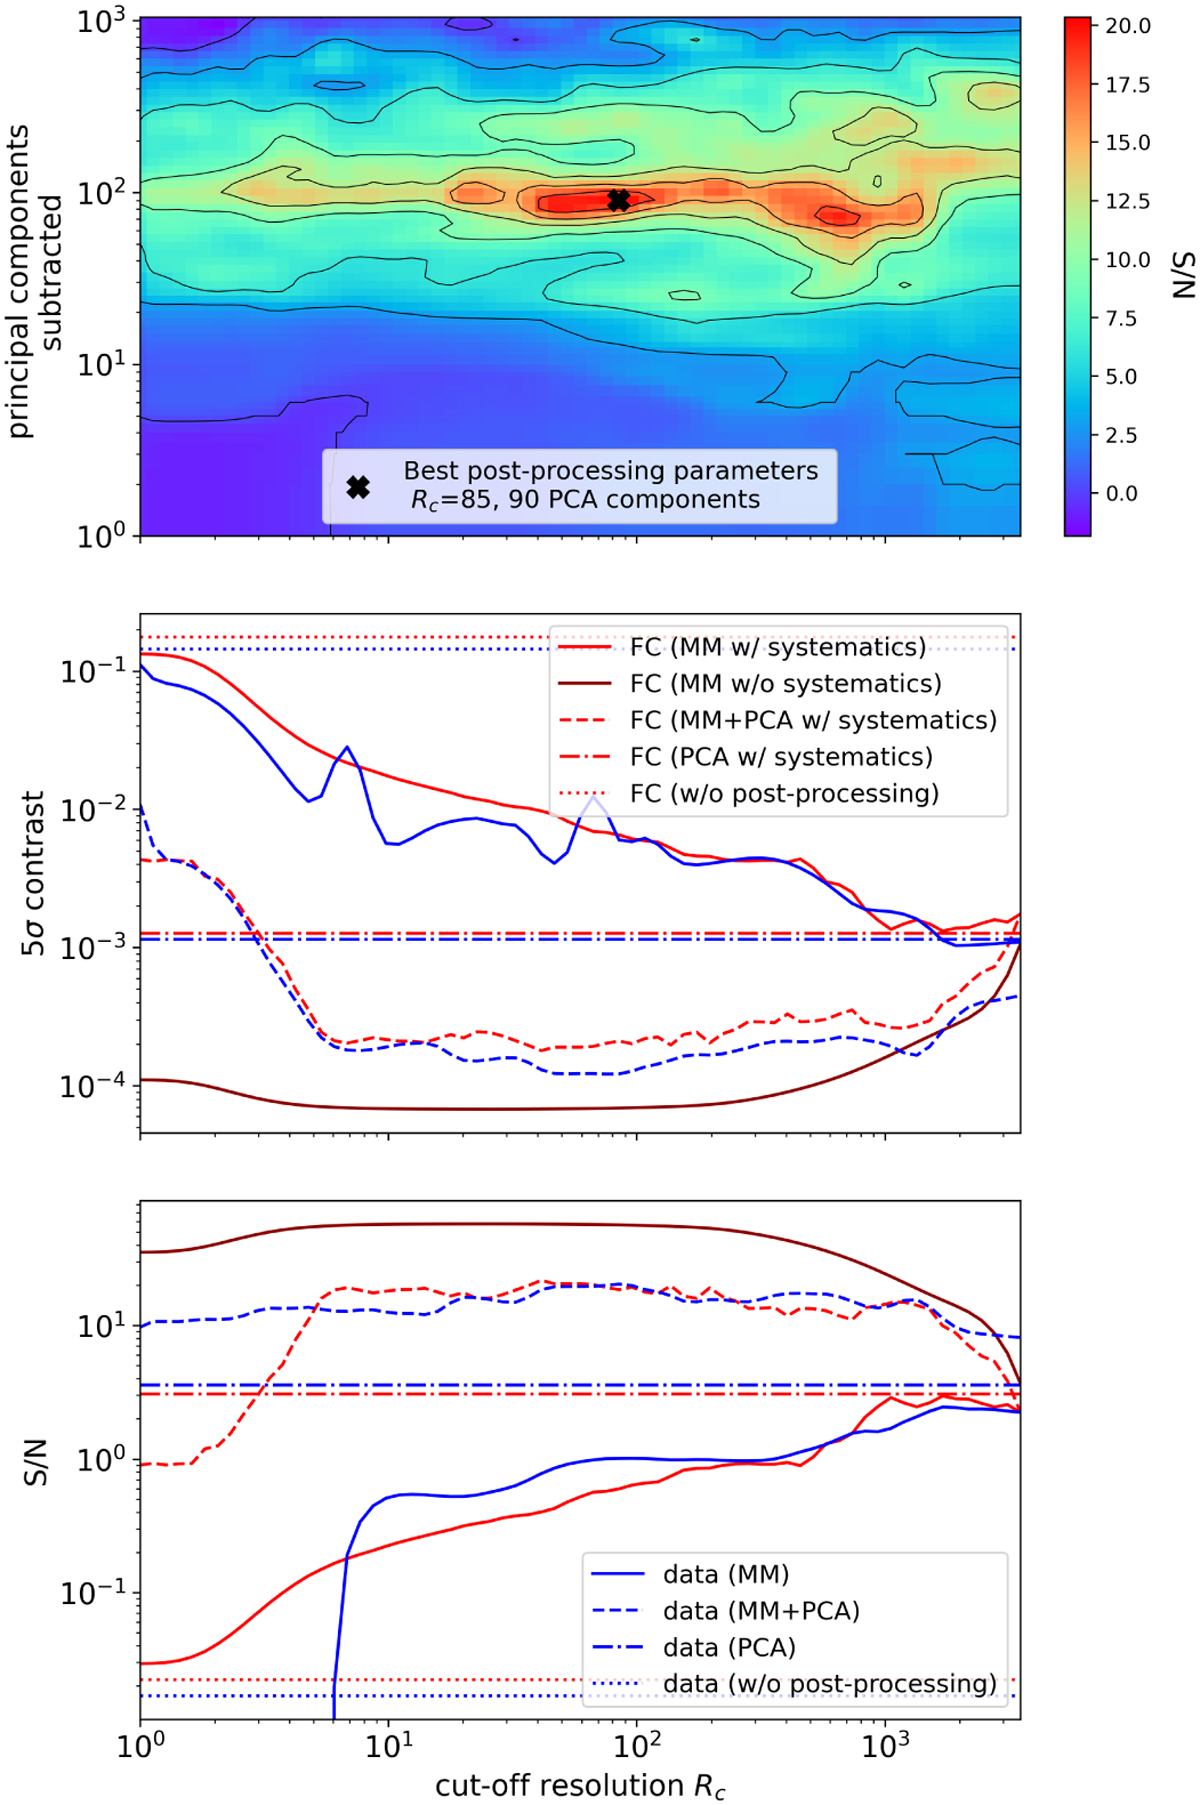
Top: S/N fluctuation map as a function of post-processing parameters on 1SHORT for β Pictoris b on-sky data. Middle: contrast curves calculated analytically with FastCurves (in red) and empirically with β Pictoris b on-sky data (in blue) on 1SHORT for various postprocessing techniques. Bottom: S/N curves calculated similarly. The plots are given at the planet’s separation (ρ ≈ 0.5″) and for 90 principal components subtracted when the PCA is applied. For FastCurves estimations, as in Fig. 9, systematics (Msim) where fringes and straylight were incorrectly subtracted by the pipeline had to be considered (see Sect. 5).
Current usage metrics show cumulative count of Article Views (full-text article views including HTML views, PDF and ePub downloads, according to the available data) and Abstracts Views on Vision4Press platform.
Data correspond to usage on the plateform after 2015. The current usage metrics is available 48-96 hours after online publication and is updated daily on week days.
Initial download of the metrics may take a while.