Open Access
Fig. 1
Download original image
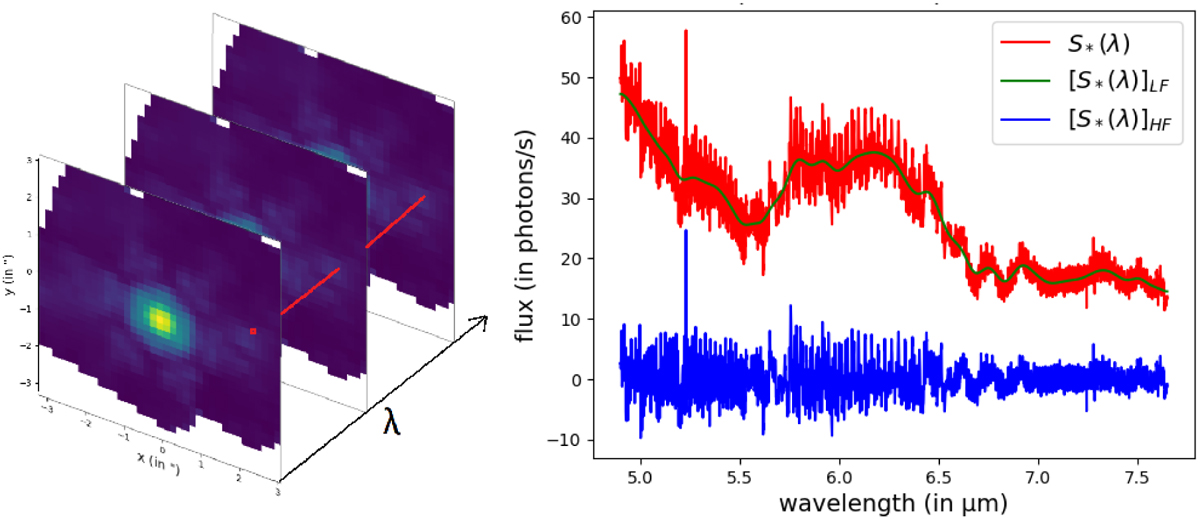
Left: MIRI/MRS data cube representation of a single star. Right: spectrum of the star at a given point (x, y) in red, with its modulated continuum in green and with high-pass filtering in blue.
Current usage metrics show cumulative count of Article Views (full-text article views including HTML views, PDF and ePub downloads, according to the available data) and Abstracts Views on Vision4Press platform.
Data correspond to usage on the plateform after 2015. The current usage metrics is available 48-96 hours after online publication and is updated daily on week days.
Initial download of the metrics may take a while.