Fig. 12
Download original image
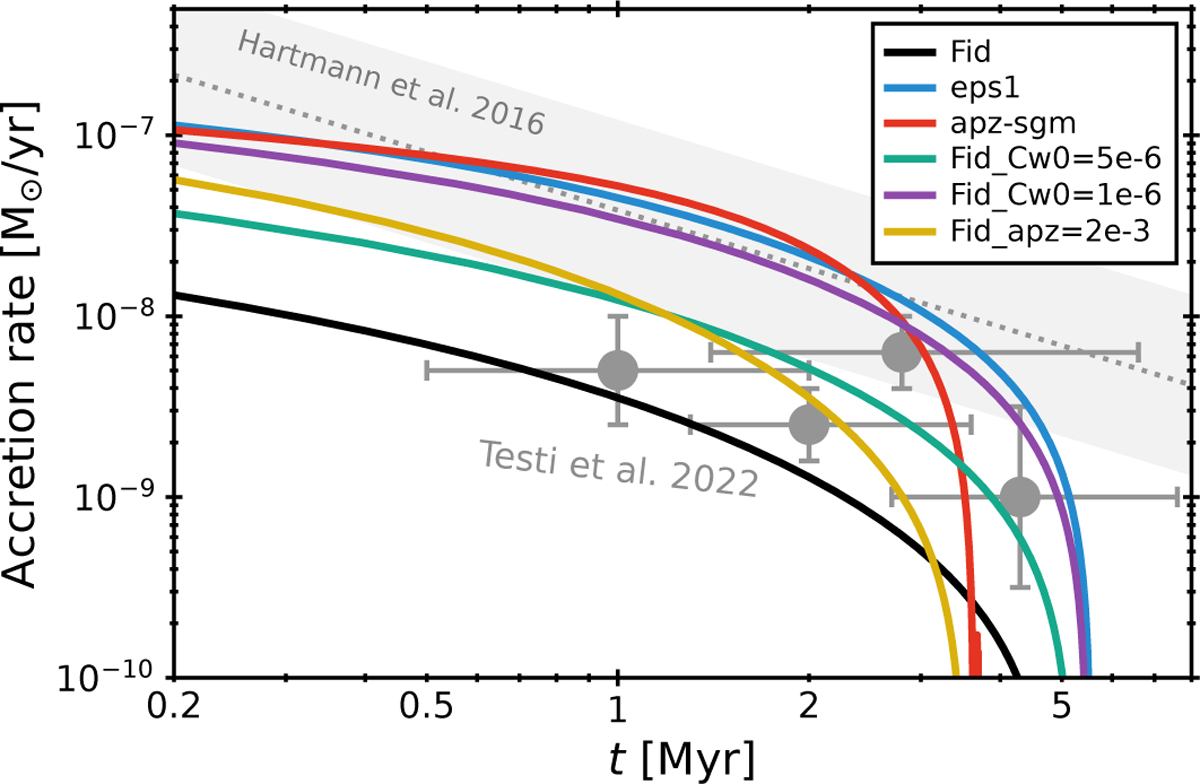
Evolution of the accretion rate in our simulations (solid lines) and the observational relation between the accretion rate and stellar age. The simulated accretion rates are measured at the inner boundary of the simulation domain. The observational ![]() relations for 1 M⊙ stars derived by Hartmann et al. 2016 (dotted gray line and shade) and Testi et al. 2022 (dark gray points with bars) are shown. The horizontal bars show the 25th to 75th percentile range of the stellar ages in each star-forming region.
relations for 1 M⊙ stars derived by Hartmann et al. 2016 (dotted gray line and shade) and Testi et al. 2022 (dark gray points with bars) are shown. The horizontal bars show the 25th to 75th percentile range of the stellar ages in each star-forming region.
Current usage metrics show cumulative count of Article Views (full-text article views including HTML views, PDF and ePub downloads, according to the available data) and Abstracts Views on Vision4Press platform.
Data correspond to usage on the plateform after 2015. The current usage metrics is available 48-96 hours after online publication and is updated daily on week days.
Initial download of the metrics may take a while.