Fig. 10
Download original image
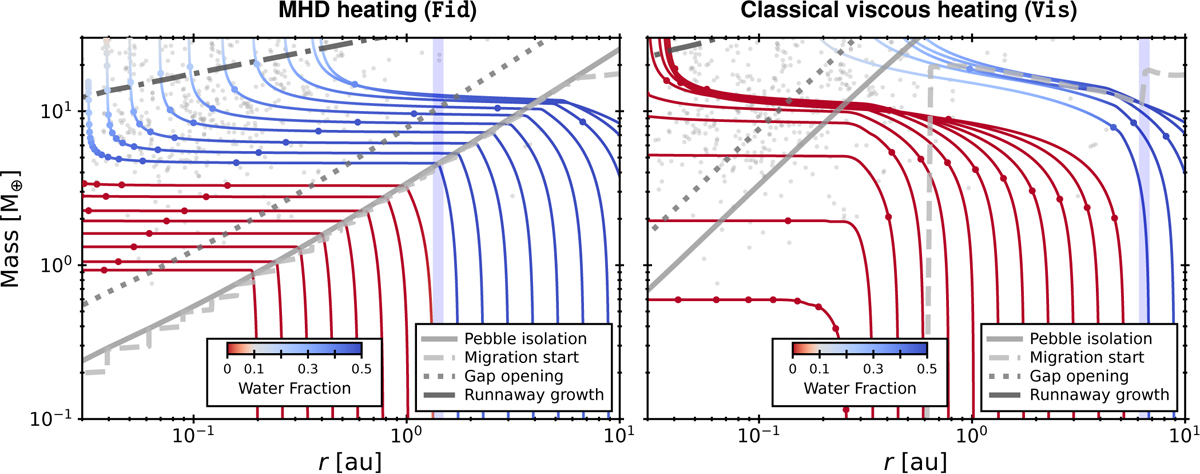
Mass–orbital tracks of protoplanets starting at Mp = 0.01 M⊕ and r = [0.2: 20] au, with early-onset growth (t0 = 0.01 Myr) and vfrag = 10 m s−1, under MHD heating (left) and classical heating (right). The total pebble mass drifting through the snowline at t ≥ t0 is 400 M⊕. The characteristic masses in planetary evolution at t = 0.1 Myr are also shown as gray lines. Planets grow through pebble accretion until they reach the isolation mass (Miso; solid line). When the growth timescale exceeds the migration timescale, migration becomes the dominant process (Mmig; dashed line). Gaps start to open when Mp reaches 2.3Miso (Mgap; dotted line). Planets grow in a runaway manner when the growth timescale again becomes shorter than the migration timescale (MRG; dash-dotted line). The points on each mass-orbital track show the elapsed time for every 0.5 Myr. The gray circles show the distribution of confirmed exoplanets orbiting stars with masses in the range of [0.8, 1.2] M⊙ (NASA Exoplanet Archive 2024). The vertical blue lines show the location of the snowline at t = 0.1 Myr.
Current usage metrics show cumulative count of Article Views (full-text article views including HTML views, PDF and ePub downloads, according to the available data) and Abstracts Views on Vision4Press platform.
Data correspond to usage on the plateform after 2015. The current usage metrics is available 48-96 hours after online publication and is updated daily on week days.
Initial download of the metrics may take a while.