Fig. 9
Download original image
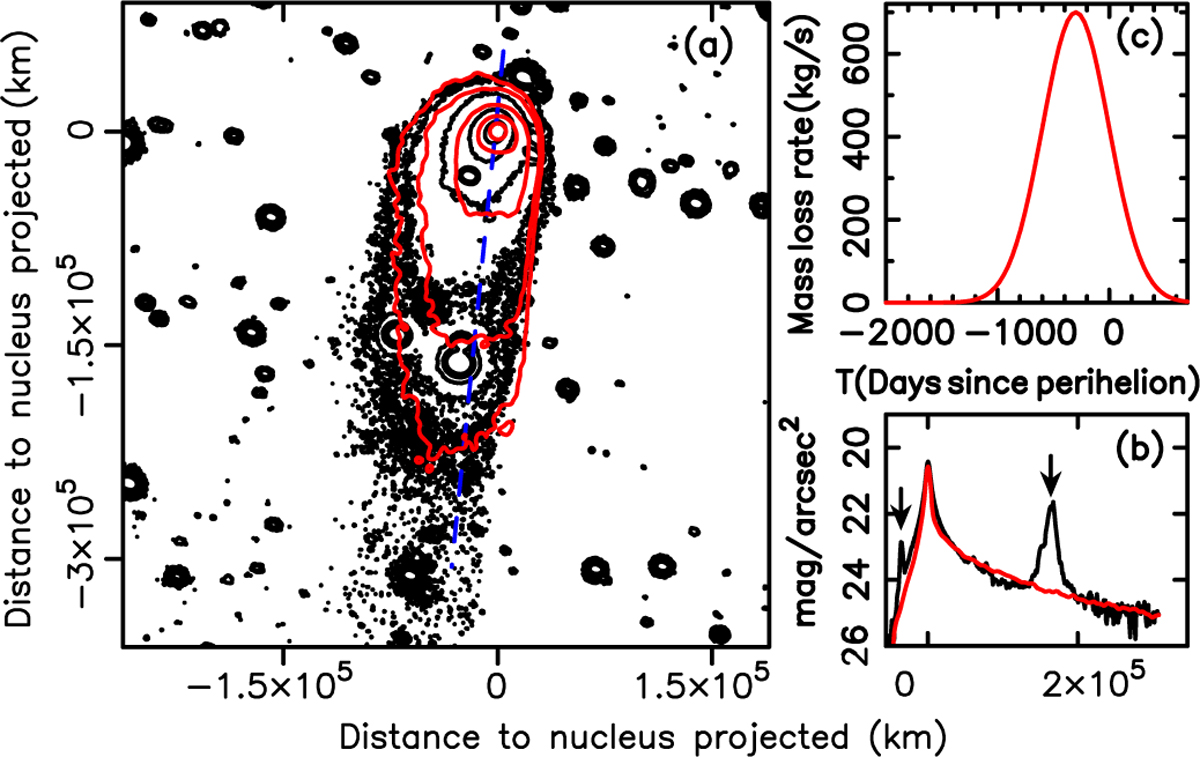
Isophote fields, dust loss rate profiles, and brightness scans along the tail of the C/2014 N3 BTA image in the r-sdss filter. In panel a, the black contours are the observed isophotes, with the same brightness levels as in Fig. 8. The red contours are the isophotes corresponding to the isotropic ejection model, whose dust loss rate profile is given in panel c. In panel a, the dashed blue line indicates the direction of the brightness scans along the tail, shown in panel b as a black line (observation) and a red line (isotropic ejection model). The spikes indicated by arrows are contaminating field stars.
Current usage metrics show cumulative count of Article Views (full-text article views including HTML views, PDF and ePub downloads, according to the available data) and Abstracts Views on Vision4Press platform.
Data correspond to usage on the plateform after 2015. The current usage metrics is available 48-96 hours after online publication and is updated daily on week days.
Initial download of the metrics may take a while.