Fig. 7
Download original image
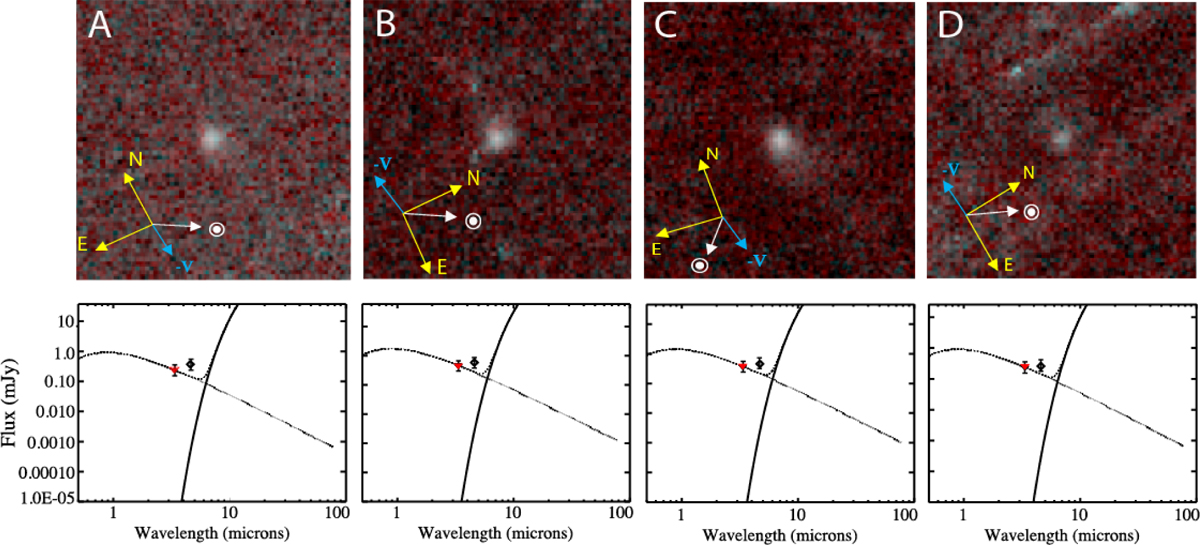
Stacked images of comet C/2014 N3 for the four NEOWISE visits with significant signals (see Table 3); on 4 July 2014 (Panel a), 13 December 2014 (Panel b), 8 August 2015 (Panel c), and 10 January 2016 (Panel d). For each panel, the 3.4 μm band stacked image is mapped to the blue and green channels, and the 4.6 μm stacked image is mapped to the red. The N and E sky directions are labeled, along with the antisolar vector (in red) and the anti-velocity vector (in blue). The photometry from NEOWISE observations of comet C/2014 N3 for each visit is shown below the stacked image. The fluxes from emissions at 3.4 μm (red triangle) and 4.6 μ (black diamond) are shown. The reflected light model (dotted line), thermal model (solid line), and combined signal (dashed line) are overplotted.
Current usage metrics show cumulative count of Article Views (full-text article views including HTML views, PDF and ePub downloads, according to the available data) and Abstracts Views on Vision4Press platform.
Data correspond to usage on the plateform after 2015. The current usage metrics is available 48-96 hours after online publication and is updated daily on week days.
Initial download of the metrics may take a while.