Fig. 2
Download original image
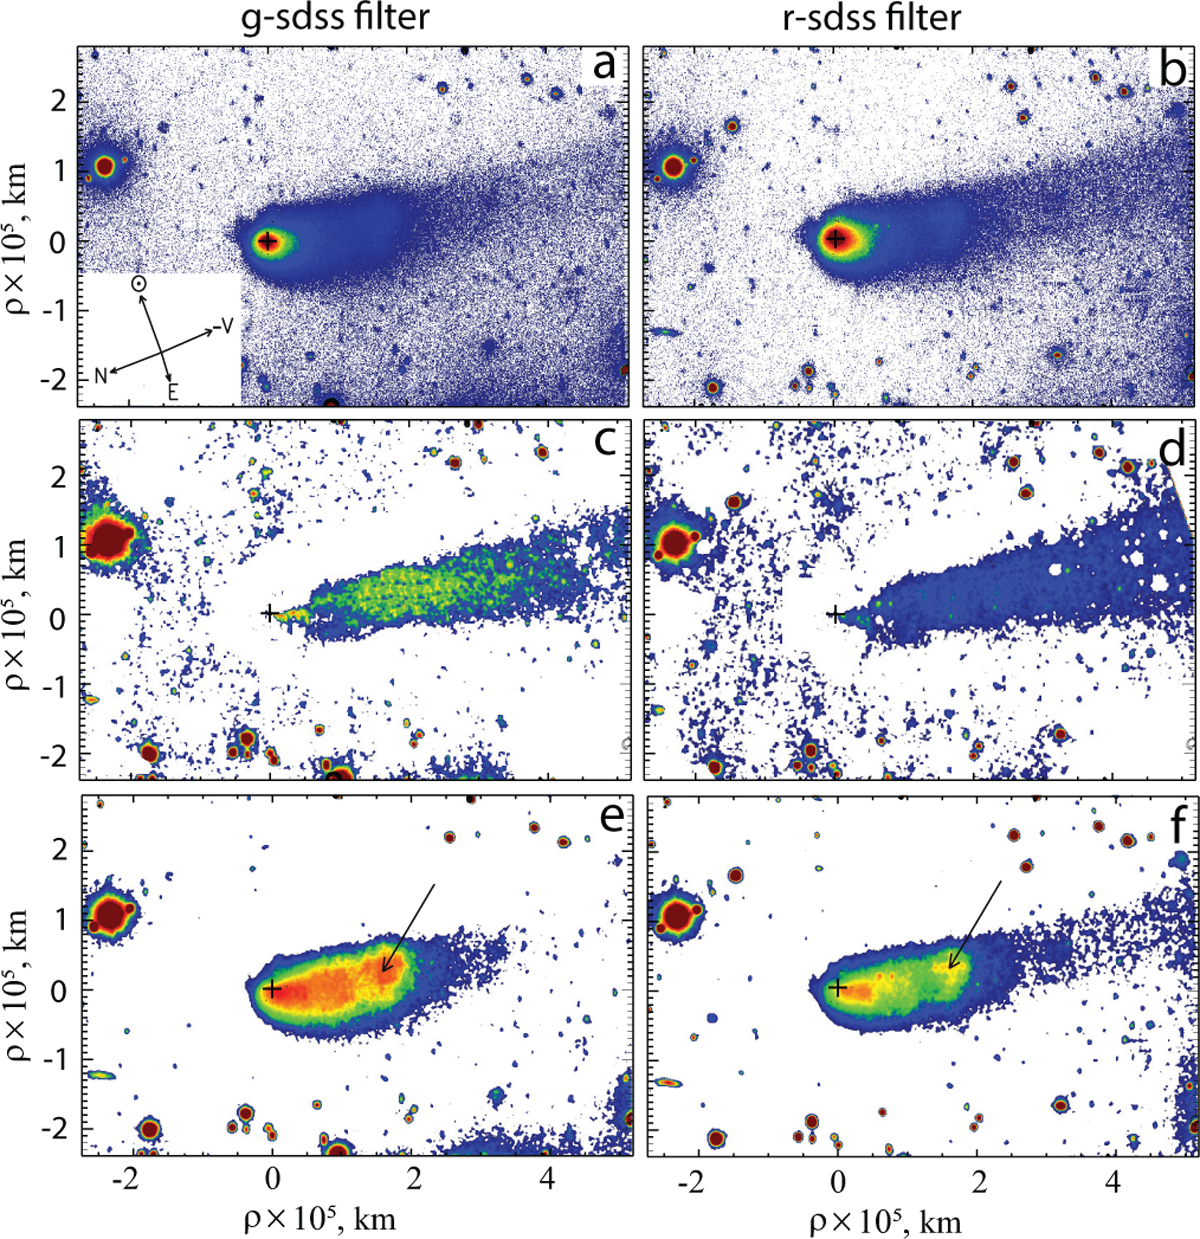
Intensity maps of comet C/2014 N3 in the g-sdss and r-sdss filters. Panels a and b: direct images of the comet. Panels c and d: images processed by the rotational gradient method (Larson & Sekanina 1984). Panels e and f: images to which a division by the 1/ρ profile has been applied (Samarasinha & Larson 2014). The color scale does not reflect the absolute brightness of the comet. Arrows in panels e and f indicate the contaminating field stars. The arrows point toward the Sun, the north, the east, and the negative velocity vector of the comet as seen on the plane of the sky.
Current usage metrics show cumulative count of Article Views (full-text article views including HTML views, PDF and ePub downloads, according to the available data) and Abstracts Views on Vision4Press platform.
Data correspond to usage on the plateform after 2015. The current usage metrics is available 48-96 hours after online publication and is updated daily on week days.
Initial download of the metrics may take a while.