Fig. 11
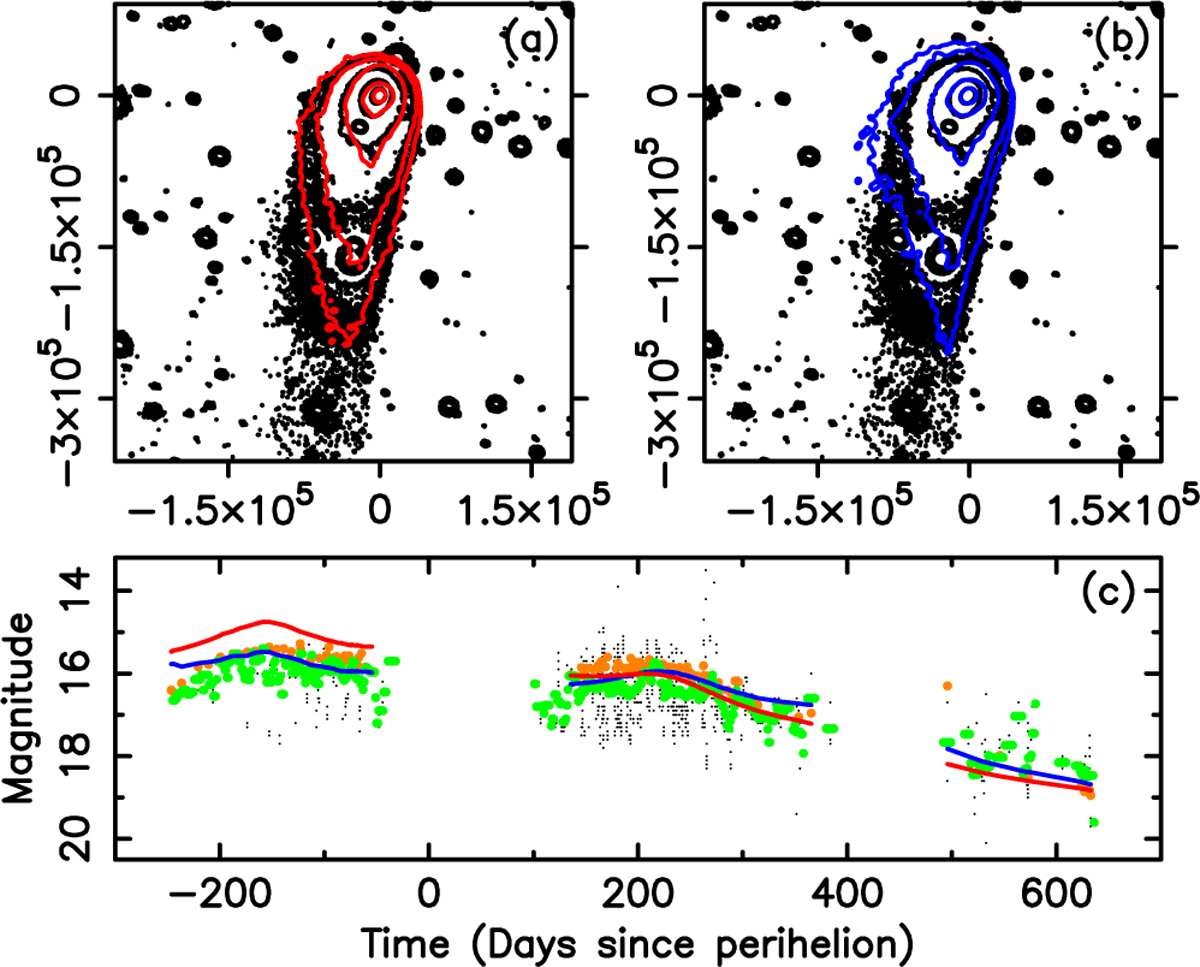
Download original image
Comparisons of the observed and model isophotes and of the synthetic magnitudes, both as a function of time to perihelion. In panel a, black contours are the observed isophotes, and red contours the sunward ejection model, with the dust loss rate profile shown in red in panel c of Fig. 10. In panel b, the black contours are the observed isophotes, and the blue contours correspond to the same sunward model as in panel a, but with the modified dust loss rate profile shown as the blue line in panel c of Fig. 10. Isophote levels in panels a and b are the same as in Fig. 8, and the axis labels are also expressed in km. Panel c displays the C/2014 N3 magnitude as a function of time extracted from the Minor Planet Center (“nuclear magnitudes”; little black dots). Also, the moving averages of these measurements are shown using 4-day-width boxes (green dots) and the R-band measurements by Cometas_Obs (brown dots). The red lines correspond to the magnitudes modeled using the sunward ejection model with the Gaussian profile (red line in Fig. 10), while the blue line corresponds to the sunward profile with the modified dust loss rate profile (blue line in Fig. 10).
Current usage metrics show cumulative count of Article Views (full-text article views including HTML views, PDF and ePub downloads, according to the available data) and Abstracts Views on Vision4Press platform.
Data correspond to usage on the plateform after 2015. The current usage metrics is available 48-96 hours after online publication and is updated daily on week days.
Initial download of the metrics may take a while.