Fig. 1
Download original image
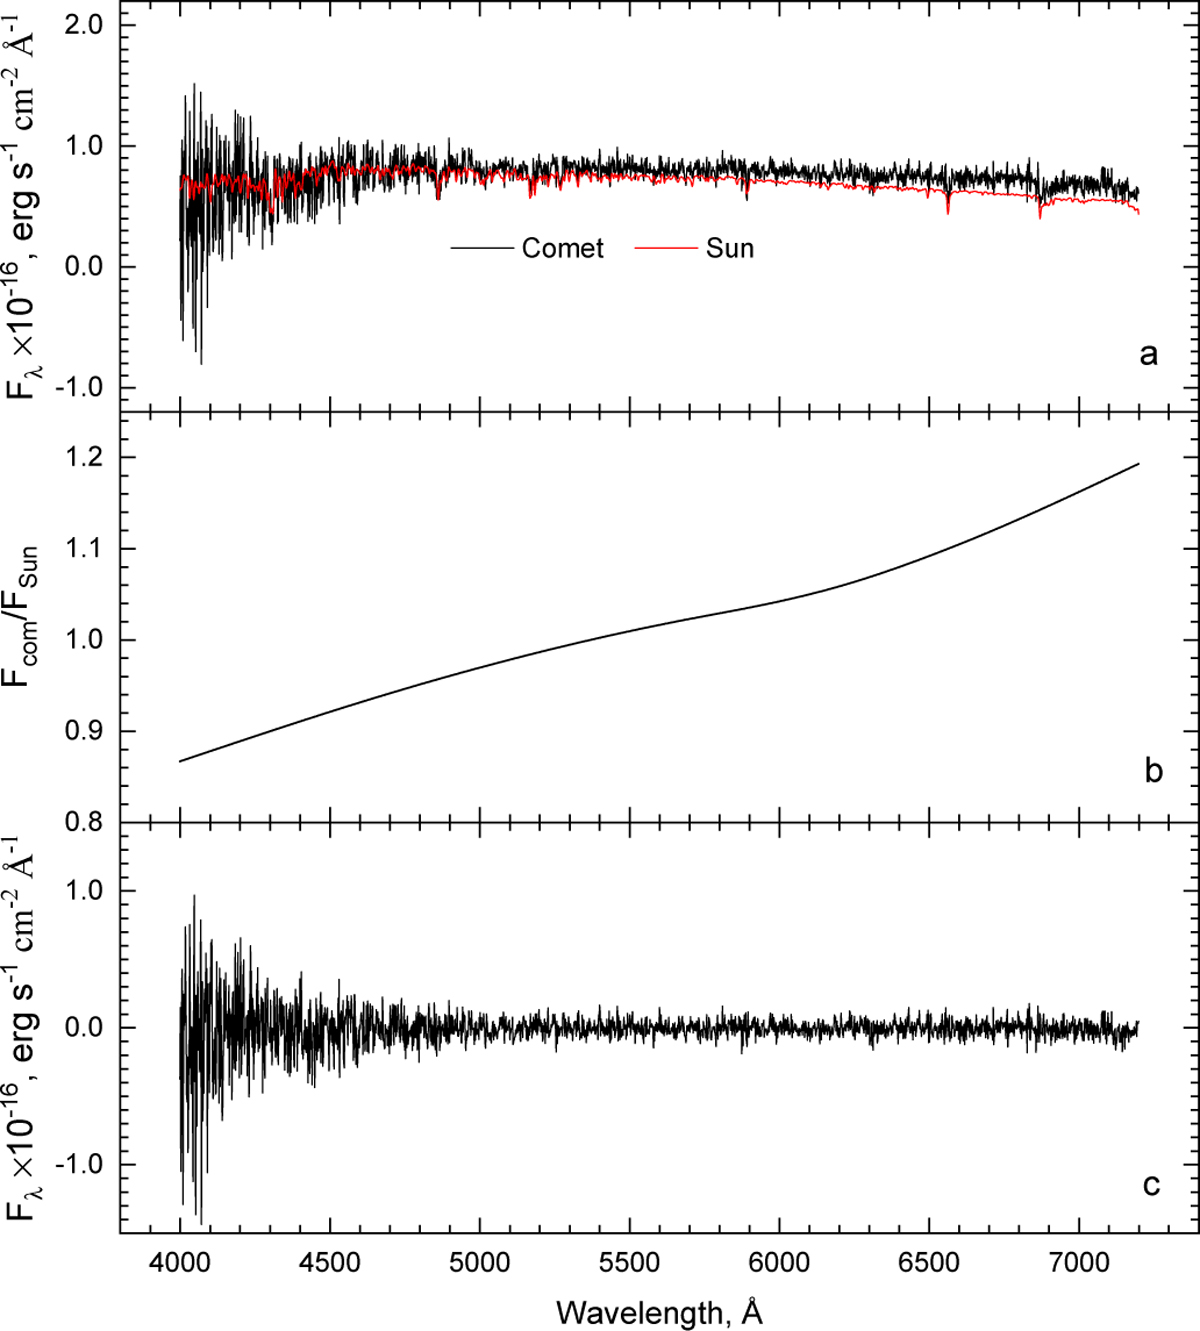
Long-slit spectrum of comet C/2014 N3 obtained on 5 December 2015. Panel a: energy distribution in the observed spectrum of the comet (black line) and the scaled solar spectrum taken from Neckel & Labs (1984, red line). Panel b: polynomial fit of the ratio of the cometary spectrum to the solar spectrum. Panel c: emission spectrum of the comet derived by subtracting the fitted continuum from the observed spectrum.
Current usage metrics show cumulative count of Article Views (full-text article views including HTML views, PDF and ePub downloads, according to the available data) and Abstracts Views on Vision4Press platform.
Data correspond to usage on the plateform after 2015. The current usage metrics is available 48-96 hours after online publication and is updated daily on week days.
Initial download of the metrics may take a while.